Notice
This page was semi-automatically translated from german to english using Gemini 3, Claude and Cursor in 2025.
Data Science: From Data to Knowledge
Introductory Example
Data Science is a collection of methods used to discover the knowledge hidden within data. As an example, let’s imagine a company that has released a new product and does not yet know who its customers are. Unfortunately, marketing neglected to identify potential customer segments before the product launch. The company now wants to know who the customers are. To this end, the company collected the following data in a supermarket:
| Age | Time of Day | Shopping Cart | Weather | Product Bought |
|---|---|---|---|---|
| Senior | Morning | Medium | Cloudy | No |
| Middle-aged | Morning | None | Cloudy | No |
| Young | Morning | Full | Rain | Yes |
| Senior | Morning | Little | Rain | No |
| Young | Afternoon | None | Rain | No |
| Middle-aged | Afternoon | Full | Rain | Yes |
| Young | Afternoon | Medium | Sun | No |
| Senior | Afternoon | Little | Sun | Yes |
| Middle-aged | Afternoon | Medium | Sun | No |
| Middle-aged | Afternoon | Full | Sun | Yes |
| Young | Evening | None | Rain | No |
| Young | Evening | Medium | Rain | No |
| Middle-aged | Evening | Little | Rain | No |
In each row, you find the data for one customer. In each column, the observed data. For the sake of simplicity, very coarse “categories” are used here to divide the individual columns.
- Customers were categorized by age into YOUNG, MIDDLE, and RETIREE.
- MORNING, AFTERNOON, and EVENING were used as times of day.
- The filling of the shopping cart was recorded as NONE, LITTLE, MEDIUM, and FULL.
- The weather was simplified to RAIN, SUN, or CLOUDY.
- And finally, whether the new product was purchased or not: YES or NO.
Now, these are only data from 13 purchases and 5 observed variables (the columns). In a data analysis, the first question you must ask is which unobserved variables might still exist. What data could improve the data analysis? Do other factors play into the purchasing decision? In reality, this is very likely. What about the customer’s clothing? Their hairstyle? If the new product is a hairspray, the hairstyle is certainly an important feature. What about the weather? If the product is ice cream, the weather is also certainly important.
One reason for the “data collection mania” of companies often complained about in the media is simply that one does not know which features are important before the analysis. So, everything is collected in advance according to the motto “it might be useful later.” From an information theory perspective, this also makes sense, because information is needed to reduce uncertainty.
The data in our example is already in good condition. It is all consistent. In reality, as discussed in Chapter 6.4, data must first be cleaned and standardized. Otherwise, in data analysis, it’s called “Garbage in, Garbage out”.
A first analysis of data is usually done with statistics and visualizations. Here, Excel’s pivot tables and charts have become very widespread. When working with new data, it is useful to first familiarize yourself with it by looking at the usual statistical indicators.
Classification and Regression
Work has been ongoing since the 1990s on the automatic extraction of knowledge from data. The field used to be called “Knowledge Discovery in Databases” (KDD), was then often referred to as “Data Mining”, and is today called “Data Science”.
In the example above, the problem is to find a connection between sales and other data to answer the question “who are our customers.” One wants to predict the “Product Purchased” column based on the values in the other columns. So-called decision trees are suitable for this. These trees can be optimally created by software based on information-theoretical criteria using the sample data. The following decision tree, for example, predicts the results of the “Product Purchased” column based on the “Shopping Cart” and “Time of Day” columns.
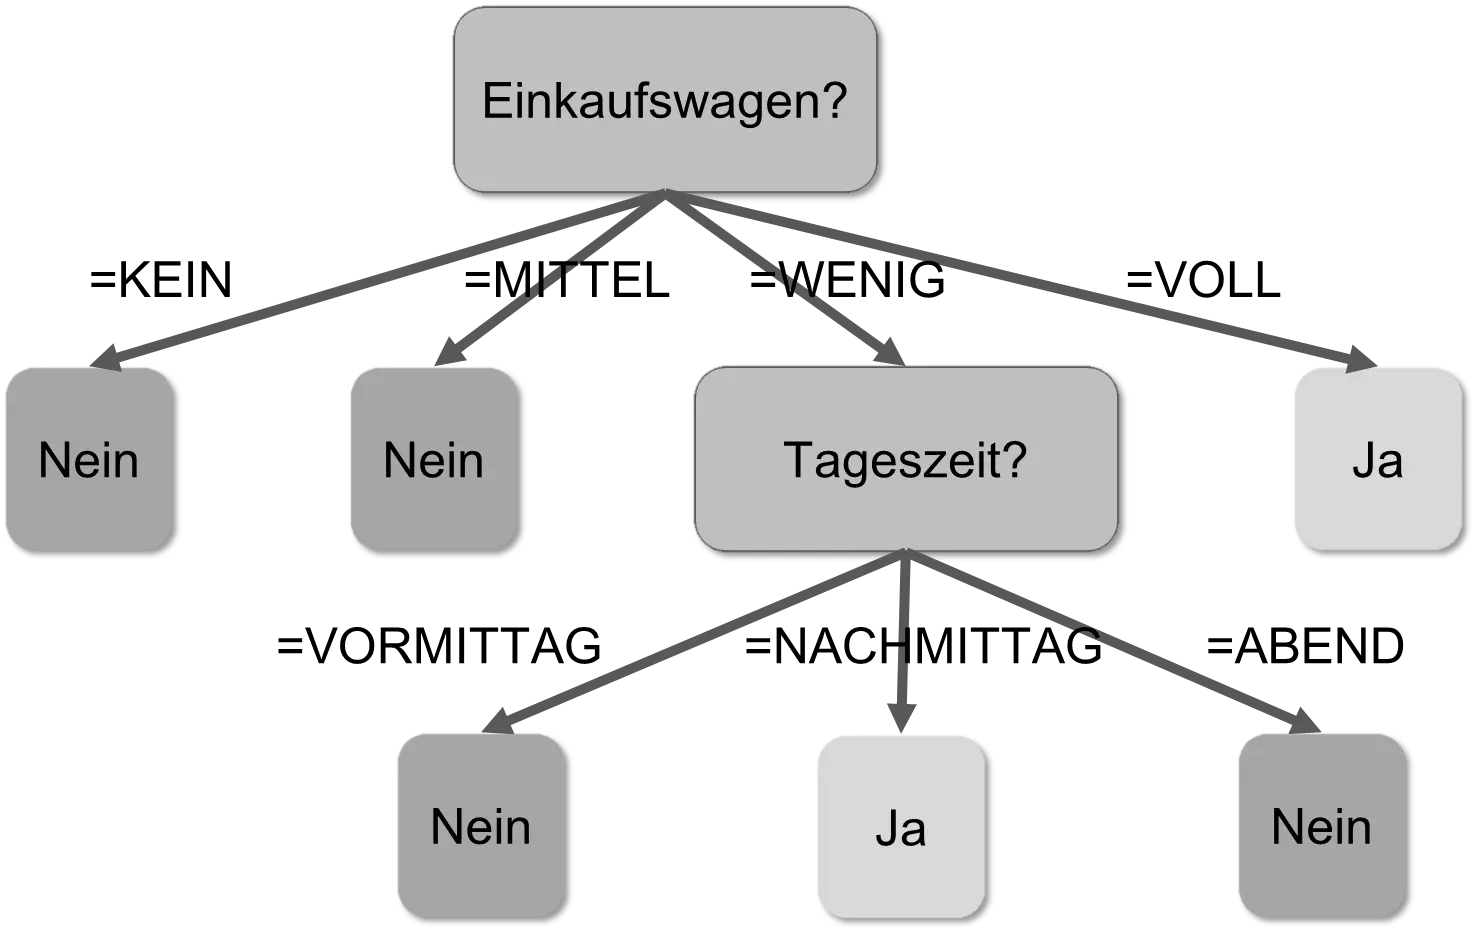
This tree is applied to every dataset. Such a tree is read from top to bottom. The elongated nodes containing a question mark are decisions; the nodes without successors are results. The tree above corresponds to the following logic: “If the value in the ‘Shopping Cart’ column is ‘NONE’, then ‘No’; if it is ‘MEDIUM’, then also ‘NO’; if it is ‘LITTLE’, then check the ‘Time of Day’ column, etc.” A decision tree corresponds to nested IF-THEN-ELSE rules. The tree above is, for example, equivalent to:
IF (Shopping Cart = LITTLE) THEN
    IF (Time of Day = AFTERNOON) THEN Yes
    ELSE No
ELSE
    IF (Shopping Cart = FULL) THEN Yes
    ELSE No
Such a decision tree contains the “knowledge” about the “Product Purchased” column. The company now knows that the product is purchased by customers with full shopping carts or in the afternoon. The company also knows that “Age” and “Weather” are not required. Data was turned into knowledge, which was stored in a data structure, in a model.
In this example, the value of a two-valued variable “Product Purchased” was predicted. Such a division into discrete symbols is called classification. Other examples of classification include [CM16]:
- Identifying the bird species from a bird’s song
- Detecting malignant tumors and diseases
If the “Product Purchased” column did not contain YES and NO, but rather the number of products purchased, it would no longer be a classification, but a regression. Techniques other than decision trees are used for regressions. Since numbers are to be predicted, the procedures are mostly mathematical in nature and have their roots in mathematical statistics. The simplest regression is linear regression, which can be explained very clearly. In the following figure, a set of points and the so-called “regression line” are drawn.
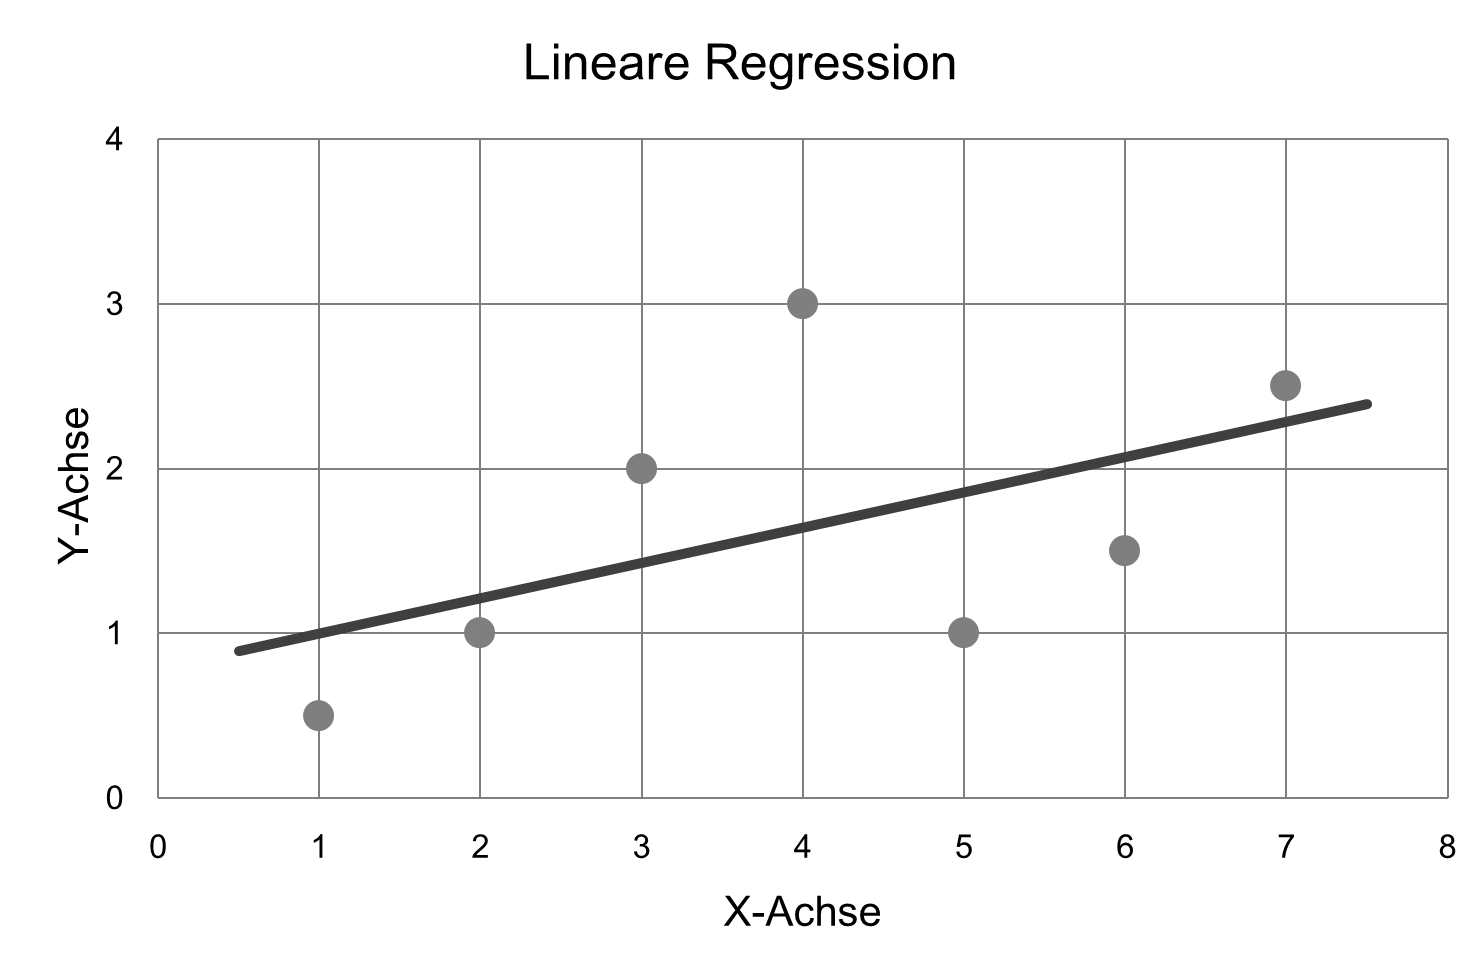
Colloquially speaking, the line is as close as possible to all points. To describe this process more precisely, however, one would have to become much more mathematical. That would exceed the scope of this book. It is enough to know that regression is a mathematical statistical procedure to bring various data points “onto a line.” Roughly speaking, the points are all on the line. One could now save only the line instead of the individual points and calculate the points using the line if necessary.
In mathematics, lines have the advantage that they are relatively easy to calculate with. However, they have the disadvantage that they approximate very inaccurately. If you perform a regression with a third-degree polynomial, the points can be matched much more closely, as can be seen in the next figure:
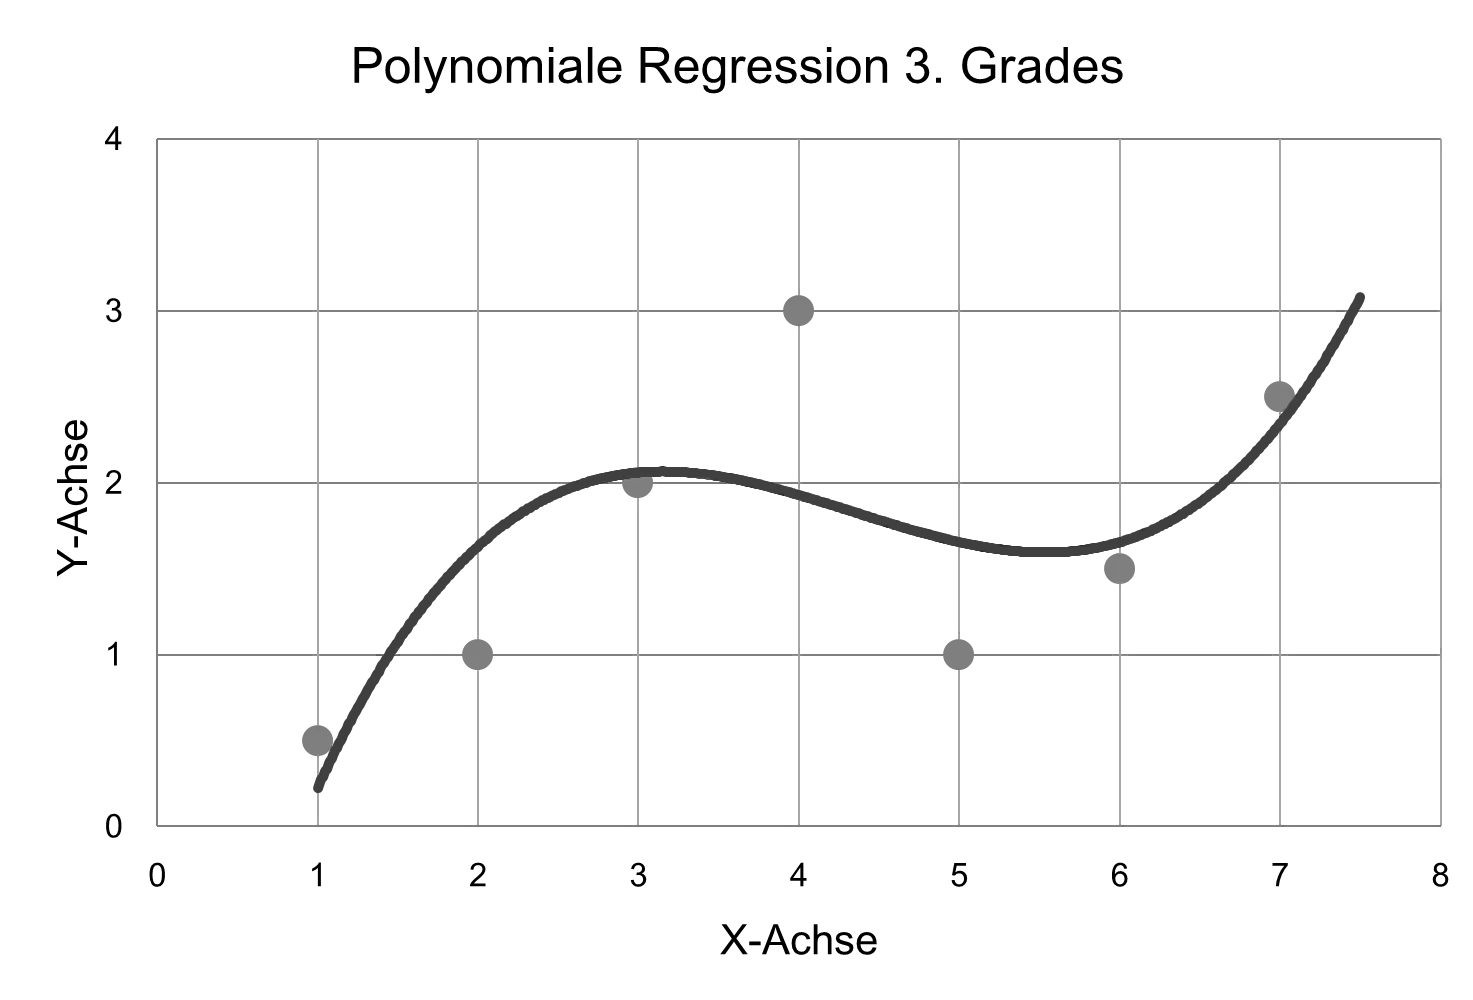
But the mathematical formulas become more difficult. Here, there is a tradeoff between accuracy and mathematical complexity. A line can be described with ax + b, but a third-degree polynomial requires ax^3 + bx^2 + cx + d. It is much easier to calculate with linear equations. Polynomial regression belongs to the so-called nonlinear regressions.
Regression has already been successfully applied in many areas, such as [CM16]:
- Finding new diamond mines based on data from the environments of previous mines.
- Which parts of a car are likely to fail next?
- How much money will a specific person spend next month?
The neural networks used in image recognition and self-driving cars are data structures that can learn nonlinear regressions from examples. We will explain neural networks in more detail later in Section 8.5.
Data Mining
The Data Mining Process
In the example above with the decision tree for supermarket purchases, a working model was found on the first run. In reality, this is unfortunately often quite different, because on the one hand there is much more data and on the other hand the data is often “noisy” and contains errors. Often you don’t even have the right data yet and have to obtain it first. The various classification methods have many parameters and weightings that must be set correctly to obtain good results. Decision trees, for example, can be “pruned” if they become too large.
Creating good models with data mining is a long and labor-intensive process consisting of the following steps [PF13]:
- Analysis of the business situation and existing data: What is to be achieved? What is the goal? Is the data good enough? (“business and data understanding”)
- Preparation of the data (“data preparation”): Cleaning, unification as in a data warehouse, and conversion into the “correct” format.
- Model creation: The actual “data mining”
- Evaluation and testing: Is the model good enough?
- Deployment of the model: Analysis or prediction
These steps are not always to be processed in sequence. Often you only realize after step 3 that you actually need more data and you have to go back to step 1.
During testing, the found model is checked against new data. What would the found tree do with the following dataset?
| Age | Time of Day | Shopping Cart | Weather | Product Bought |
|---|---|---|---|---|
| Young | Evening | None | Rain | Yes |
It would say ‘NO’ because the shopping cart is ‘NONE’. But with that, it would deliver a wrong answer. The sample data for training the tree did not include this case. It is therefore important that the data used for training contains as many combinations as possible. In addition, different data are needed for training and testing.
Suppose the company knows the supermarket’s customers and wants to use the decision tree to predict how many products it needs to deliver to the supermarket. They use the tree for prediction.
If a classification yields a wrong result, there are two different possibilities:
| Buys | Doesn't Buy | |
|---|---|---|
| "Buys" predicted | Correct |
Error False positive Revenue- Inventory- |
| "Doesn't Buy" predicted |
Error False negative Revenue+ Inventory- |
Correct |
If the model says ‘NO’, but the customer buys, the prediction is “false negative”. If the model says ‘YES’, but the customer does not buy, the prediction is “false positive”.
In both cases, it results in inconveniences for the company, but they have very different consequences. An error here is not just an error. In a false positive, one product too many was delivered to the supermarket, but revenue will be lower than expected. In a false negative, there is one product too few in the supermarket’s warehouse. Overall, more could have been sold.
In other scenarios, the costs for both classification errors are even higher. Imagine a model designed to detect credit card fraud. The system examines every dataset and can sound an alarm or not.
| Fraud | No Fraud | |
|---|---|---|
| Alarm | Correct | False Alarm |
| No Alarm | Undetected | Correct |
The false positives are now false alarms. Normal operations are interrupted, the police are called, etc. All of this incurs costs. The false negatives are undetected fraud cases, which also cause immense damage.
The error rate of a classifier is the number of incorrectly classified datasets. In general, an attempt is made to keep this error rate as low as possible. If false classifications cause higher costs, the models must, of course, be tested and refined for a long time.
Important: Data mining is an iterative process in which the error rate is gradually improved.
Creating a working model for prediction is therefore anything but simple; it is a time- and labor-intensive task that requires a great deal of knowledge about the application area and data mining procedures. Another difficulty is that learning is easiest when feedback is received as often as possible. Let’s consider weather forecasting as an example. Here, a forecast can be made daily and the model can be checked daily. The error rate can be improved daily. Retail revenue during the Christmas season, on the other hand, can only be predicted and checked once a year. Here, it probably takes decades until the model has a good error rate [TG15].
The impression often arises in the media that with Big Data and Artificial Intelligence, computers suddenly know everything about people and can monitor them. This knowledge, however, must be extracted from raw data for each specific question through an elaborate data mining process. It is not as if you simply have to show the data to the computer and “insights and wisdom fall from the sky.” Data mining programs are a means to handle large amounts of data. They are based on statistical and information-theoretical algorithms.
Important: The intelligence lies in the data scientists who apply the methods intelligently to selected data.
Other Techniques
The two procedures discussed, classification and regression, count as “supervised learning” methods. It is called “supervised” learning because you tell the algorithm what it should learn. It is learning by example [PF13]. In the example above, it was the “Product Purchased” column. In addition to decision trees, there are many other techniques for classification and regression, such as neural networks, Bayesian networks, or support vector machines [PF13, SB14].
In “unsupervised learning” methods, no target to be learned is specified. These methods are therefore used more for analysis [PF13].
In cluster analysis, an attempt is made to divide the datasets into k different groups. In doing so, the datasets within a group should be as similar as possible. Cluster analysis is used, for example, in dividing customers into customer groups.
In profiling, a model of the behavior of users or customers is created to predict their future behavior or to identify deviant behavior. A typical use case is an Intrusion Detection System (IDS) that creates a profile for each user. If a hacker breaks into the computer and behaves differently than the user, the IDS notices atypical behavior and can sound an alarm.
In market basket analysis, an attempt is made to find out which products are bought together. This also forms the basis for recommender systems based on the motto “Customers who bought this product were also interested in…”.
Theory of Machine Learning
Behind all these learning processes stands a sophisticated mathematical theory, “computational learning theory” or the theory of machine learning [SB14]. This examines, for example, which concepts are learnable at all with which methods, how many examples are required for this, and what maximum error rate can be achieved. It is a very mathematical theory between statistics and computer science. One result of the theory is that you cannot simply learn every concept to make error-free predictions. The situation is much more complicated. As a rule of thumb, one can say that the simpler the concept to be learned and the more extensive the data, the better the prediction.
Important: Learning has information-theoretical limits. Complex systems remain complex and unpredictable even for machine learning methods.
Text Mining
When processing texts in natural language, different techniques are needed than in traditional data analysis, because texts belong to “unstructured” data. Of course, natural languages have a structure, such as syntax and grammar rules, but this structure is not at the semantic level, i.e., at the level of meaning. A computer cannot (yet?) understand the meaning behind language. But it can process language based on syntax and rules, and partial successes have already been achieved in many areas [CM16, PF13].
In text classification, for example, emails are divided into categories based on keywords and their frequency of occurrence. This is used in customer service in large companies to forward complaints to the right department. In sentiment analysis, an attempt is made to determine the mood or attitude of the author. With text mining, forgeries and plagiarism can be detected, or standardized reports on, for example, stock prices can be written.
Most tools in the field of text mining are “ad-hoc”. They are not based on linguistic theories but “trick” their way into understanding. Today, text mining is a mixture of linguistics, computer science, statistics, and machine learning.
More on natural language processing follows later in Section 8.2.
Software
There are very good software packages for trying out Data Science and Data Mining:
- Weka 3 is open source and written in Java, see http://www.cs.waikato.ac.nz/ml/weka/
- Orange is open source and uses Python, http://orange.biolab.si/
- RapidMiner Studio is available as a Community Edition, https://rapidminer.com
Data-Intensive Science
The new possibilities through Big Data and Data Science have led to data-intensive science. The sciences have, in simplified terms, gone through the following steps (according to [HTT09]):
- Experimental
- Theoretical
- Computational
- Data-Intensive
About 1000 years ago, science was “experimental”. Natural phenomena were observed and replicated in experiments. About 400 years ago, science became “theoretical” and people began to form theories about the observed phenomena, creating models, abstractions, and generalizations. Examples include Newton’s laws and Maxwell’s equations. Since the 1960s, science has been “computational”: theoretical models were calculated and verified with computers. One began with simulations, which led, among other things, to agent-based modeling. Since around 2010, there has been “data-intensive” science. Data is captured during experiments or simulations and then processed with Big Data and analyzed with Data Science.
Important: Big Data and Data Science are a means of reducing uncertainty so that organizations can make better decisions.
This applies to all organizations, including companies as well as science, environmental organizations, and state institutions.