Notice
This page was semi-automatically translated from german to english using Gemini 3, Claude and Cursor in 2025.
The Raw Material: Data
Data, Information, and Knowledge
A Distinction
People’s private lives have changed significantly due to new technologies, the internet, mobile phones, tablets, and apps. One can easily look up knowledge on the internet and no longer needs to laboriously open and search through city maps, encyclopedias, or dictionaries. What used to fill entire libraries now fits on a USB stick. Companies have also found many ways to utilize these new technologies. Many companies have since become information-processing “organisms.” Most employees of a company are no longer traditional physical laborers, but knowledge workers. Most money in banks today “exists” only in a database on a computer. For many products, such as cars, there used to be very few features for a single model. Today, you can assemble and configure your personal, almost unique car.
The cause of these changes is the ability to process information with “computers” and transmit it via networks. With the internet, the information and knowledge age has outgrown its infancy.
But what exactly is data? Information? And what is the difference to knowledge?
- Data
- Information
- Knowledge
- Belief
These terms are often used in everyday life without people being clearly aware of their exact meaning. It is important for this book to distinguish and define these terms a little more precisely.
Data generally refers to facts, values, or formulas obtained, for example, through measurement or input. In data processing, data consists of characters or symbols. Data is stored on computers in files.
The content of data is called information. As explained in Section 5.3, there is a precise information theory. There is absolute information, which indicates how much storage space is required for the information. And there is relative information, which indicates the reduction of uncertainty (entropy).
Knowledge is information that is generally accepted by people as true or valid. With knowledge, one is fairly certain that it is true. Knowledge can be proven, either through a proof or an experiment. If proof is still pending, it is a conjecture or a hypothesis. Belief, on the other hand, expresses a conjecture that has not yet been proven or cannot be proven at all. Christians, for example, state that they believe in a God precisely because no proof of God’s existence exists.
Important: Data is the container, information is the content, and knowledge is the totality of “true” information.
Data can contain information and useful knowledge. However, this information must be extracted or interpreted from the data. A context is often required for the full interpretation of information. A message with the content “at 10:30 AM” contains too little content on its own. To understand it, one must know the previous messages, for example, whether it is about a meeting at a specific place or a phone call.
For this reason, data analysis is used to try to find the knowledge contained in data. The established technique for this was statistics, which, however, could only handle smaller amounts of data. With the help of computers, new methods in data mining and machine learning were developed, with which even large amounts of data can be processed. Today, these techniques are summarized under the term Data Science.
Different Formats
There are different types of data. This data can be generated and processed by humans or by computers. Usually, you can recognize the type by the file extension: Vacation1.jpg is likely a picture from a vacation in JPEG format, and Party3.mp3 is likely party music in MP3 format. Here are a few more examples of data:
- Text data in natural language, such as English or Japanese: *.txt
- Program code in the Java programming language: *.java
- Data from applications and apps: word processing *.doc, spreadsheets *.xls
- Audio: *.mp3, *.flac
- Photos, images, drawings, scanned documents: *.webp, *.jpg
- Video / movies: *.mov, *.mkv
- Compressed data: *.zip, *.7z
There are countless more. Technically, each of these files consists of a series of bytes, i.e., numbers from 0 to 255 with 8-bit storage space. How this series of bytes is interpreted varies from app to app and must be implemented by the app’s programmers. The same sequence of bytes has a different meaning for a word processor than for an MP3 player. This can be easily seen if you open an MP3 file with a word processor, but make a copy of the file beforehand just to be safe.
Different Purposes
Data can be divided into the following groups based on its intended use:
- Application data
- Operational data
- Legally required data
Application data is created by the users themselves. Examples include documents for word processors, MP3 files, videos, etc.
Operational data is generated by the application or the computer system and consulted for error analysis and system monitoring by system administrators or developers.
- Logging data
- Database transactions
- Free memory space at a specific point in time
- CPU utilization at a specific point in time
System monitoring refers to the system, not the users. There are software systems that are critical to the functioning of a company. For an online retailer, for example, the database with products and orders must not fail. During monitoring, many parameters of the system are checked to see if everything is in order. What is the operating temperature of the CPUs? How much space is left on the hard drives? Are the systems overloaded?
Legally required data must be stored due to legal requirements. The most famous requirements and regulations are the following [Cor11]:
- Sarbanes-Oxley Act for all companies traded on a stock exchange in the USA.
- Basel II and Basel III for banks in the EU.
- Environmental regulations of the EU and the World Trade Organization.
Basel III and Sarbanes-Oxley explicitly prescribe to banks and companies which data they have to deliver in which reports and how often. These measures are intended to make the financial sector more secure against crises. When a regulation is newly introduced or changed, companies must implement it and change their existing systems and workflows. For companies and organizations, data protection regulations determine exactly which data they must, may, or may not store and for how long. There are different requirements in different countries.
Different Types
Data can also be categorized by its format: Text data contains text in languages. These can be natural languages, such as English or Japanese, or formal languages, such as programming languages. Binary data refers to data that must first be decoded. Examples include audio files, photos, images, drawings, scanned documents, videos, and movies.
Text data can further be distinguished by whether a so-called “data model” lies behind it:
- Structured: the data is formatted according to a data model.
- Semi-structured: there is no explicit data model, but there is still a recognizable structure.
- Unstructured: no simple structure is recognizable, such as text in natural language.
Structured Data
Structured data depends on a data model. The standard example of structured data is the table. The data for the three “planets” from Section 2.3 could look like this in a table.
| Id | Color | Mass | Position | Velocity |
|---|---|---|---|---|
| 1 | blue | 3 | (2, 1) | (2, 0) |
| 2 | gray | 4 | (5, 3) | (0, 0) |
| 3 | red | 2 | (9, 4) | (-1, -1) |
The format of the data is defined by the data model, the so-called metadata. A data model specifies what the data should look like, which data must be present, which are optional, and what format the data must have (string or number). A data model therefore determines the permissible data records. The data model for the table above is:
- Color: String
- Mass: Integer (an integer is a positive or negative whole number 0, 1, 2, …, -1, -2, …)
- Position: 2D vector with integers in the format (Integer, Integer)
- Velocity: 2D vector with integers in the format (Integer, Integer)
Metadata is actually data about data. If a stranger were to receive the table above, they wouldn’t know exactly what format the data is in, which values are correct and which are wrong, without the metadata. The metadata defines the format of the data (syntax) and not the meaning (semantics). Only a person with the relevant expertise can decide what the data means.
CSV, JSON, and XML
The following three file formats have established themselves for storing tables: CSV, JSON, and XML.
CSV stands for Comma-separated values. Unfortunately, the comma is very often used within data, such as with the vectors in the table above. Therefore, the semicolon is often used as a separator: i.e., “semicolon-separated values,” as in the following example:
blue;3;(4,1);(2,0)
The individual values “blue”, “3”, “(4,1)”, and “(2,0)” are separated from each other by a semicolon. The advantage of this representation is its concise expression and thus the low storage space required. However, the metadata is not automatically supplied here, so CSV is only semi-structured.
The programming language JavaScript is frequently used in web browsers to make web pages dynamic, effectively “breathing life” into the pages. The JSON format (“JavaScript Object Notation”) is used for storage here, in which the example looks like this:
{
    "color": "blue",
    "mass": 3,
    "position": "(4,1)",
    "velocity": "(2,0)"
}
Here, the name of the attribute, a colon, and the value of the attribute are written in each line. With JSON, there is no automatic mechanism that ensures the data records actually have all four attributes “color”, “mass”, “position”, and “velocity” and that these attributes have the correct values—for instance, ensuring that “mass” isn’t simply specified as “very large” when it should be a number. Therefore, JSON is also semi-structured.
In the XML data format, the data could look like this:
<circle>
    <color>blue</color>
    <mass>3</mass>
    <position>(2, 1)</position>
    <velocity>(2, 0)</velocity>
</circle>
Here, the values are specified between so-called tags. A tag has a start tag
Unstructured Data
With unstructured data, there is no data model through which the data can be easily recognized. Unstructured data can be further divided into two groups: repetitive data and non-repetitive [IL14]. An example of repetitive unstructured data is log messages from a program. Here is an excerpt from a startup of Gephi from Section 2.3:
[INFO] Heap memory usage: initial 64,0MB maximum 455,5MB
[INFO] Non heap memory usage: initial 2,4MB maximum -1b
[INFO] Garbage collector: PS Scavenge (Collections=8 Total time spent=0s)
[INFO] Garbage collector: PS MarkSweep (Collections=2 Total time spent=0s)
[INFO] Classes: loaded=5729 total loaded=5729 unloaded 0
[INFO] INFO [org.netbeans.core.ui.warmup.DiagnosticTask]: Total memory 17.076.875.264
This is a mixture of structure, such as the INFO label and the colon present in every line, and natural language.
The processing of texts in natural language has improved significantly in recent years. Natural Language Processing (NLP) is a subfield of Artificial Intelligence and is covered in Chapter 8.
Data in Practice
Application Data in Telecommunications
Mobile phone companies often offer different tariff options:
- Flat rate: everything included
- Limited quantity: e.g., 50 free SMS
- Limited duration: e.g., 2 free hours per month
- Restricted destinations: free calls to their own network, but others are subject to a fee
In order to be able to create the bill at the end of the month, the mobile phone company must remember how the customer behaved. Telecommunications companies maintain a database for this purpose, in which every chargeable event of a user is recorded. Typically, at least the following data is stored in such a data record, called a Call Detail Record (CDR):
- Source (A-party)
- Destination (B-party)
- Time of connection start in seconds
- Duration of the connection in seconds
- Cell ID
- Destination zone (for long-distance calls)
- International Mobile Equipment Identity (IMEI) of the source device
When participant A calls participant B, this data is recorded and stored in a database. Due to data protection requirements, these databases are, of course, subject to confidentiality and are not accessible from the internet by hackers.
The data records then look like this in a CSV file on the computer, for example…
01790012345;040123456;121034;105;…
01790012345;0179123456;121402;30;…
01790012345;0300123456;165542;310;…
These data contain three phone calls. This data is called connection data1. Based on these data records, it is determined at the end of the month how many calls a user made and how long they were in total, i.e., the total duration. Such a calculation is called aggregation. One also says the data is “highly aggregated.” You can aggregate at different levels: per hour, per day, per week, per month, per year, etc. This is called the aggregation level. These aggregated data are then used for billing. However, there must also be a database with the billing address and account information.
In the prosecution of criminals, this connection data is useful because all calls made by a suspect can be determined. For this reason, telecommunications companies were instructed to store this data “on reserve” in case the police or an intelligence service might need it. This data retention is justified as a measure for fighting terrorism and is very controversial. Proponents say that data retention made an important contribution to solving the 2004 Madrid bombings; critics see it as “mass surveillance” [Shn15].
The only problematic parts of this data are those that can be used to identify the individuals involved, i.e., the A and B numbers or the IMEI of the mobile phone. Therefore, these are often encrypted.
The remaining data has immense value for the telecommunications company. For example, it can be used to calculate the load on the network and optimize the network. Which mobile cells are used when and how heavily? Which cells need to be improved and expanded? Which are redundant? This data is also useful for researching customer wishes. How often do they make calls? Which services are used? Are there offers they don’t use?
Troubleshooting with Logging Data
Computer systems run unattended. You can’t have a supervisor for every computer. Humans are also not fast enough to keep up with a computer. A web server answers thousands of queries per second.
What happens if a system in a company does not behave as it should? If an error occurs, if it has a bug? Imagine a customer calls and says their system didn’t behave as it should have half an hour ago. So you receive a “bug report.” Usually, there are so many of these bugs that you have a separate computer system to manage and process them. Customer service then enters the described error into this system and assigns the “ticket” a priority. Some bugs are so important that developers should drop everything and deal with the bug directly. Others, however, are not as important, so a ticket might be a few days old when a developer finally processes it.
Now the developer sees an error description like “On Wednesday, Oct 13, 2015 at 12:45 PM, Customer X wanted to change their data and the following error occurred…”.
What to do? That was so long ago. The developer needs a so-called history where they can look up what was happening at the specified time. For this reason, every computer system has a logging system with which important events are recorded [CSP12]. These logging messages are usually stored in files. Here is an example of such a file:
12:32:08.400 [DEBUG] [org.gradle.process.internal.DefaultExecHandle] Changing state to: STARTING
12:32:08.405 [DEBUG] [org.gradle.process.internal.DefaultExecHandle] Waiting until process started: command 'C:\Program Files\Java\jdk1.8.0_65\bin\java.exe'.
12:32:08.411 [DEBUG] [org.gradle.process.internal.DefaultExecHandle] Changing state to: STARTED
12:32:08.418 [INFO] [org.gradle.process.internal.DefaultExecHandle] Successfully started process 'command 'C:\Program Files\Java\jdk1.8.0_65\bin\java.exe''
12:32:08.418 [DEBUG] [org.gradle.process.internal.ExecHandleRunner] waiting until streams are handled...
Here, the program notes the exact time in milliseconds and what it did then.
The developer who wants to find the cause of the error must go through the log files, reconstruct the state of the system at the time before the error, and trace the actions of the system that led to the error. This is not always easy. Sometimes days of analysis and research are necessary, especially with complicated and extensive systems.
As a rule, no application data is stored in the logging data. If someone changes their address in the database, the log says “Changed data record with ID 123.” The data itself is not contained there. Otherwise, that would be a major security hole.
Logging is also used to check security. Operating systems and networks, for example, log user logins. So-called Intrusion Detection Systems constantly analyze these log files and try to prevent possible break-ins by hackers or at least detect them as early as possible and trigger an alarm.
Logging data also provides information about which features in a program are used how frequently. Software manufacturers use this data to improve their programs.
Data on an Internet Platform
With an internet application, it is not always easy to determine exactly where the data is now. Usually, however, it resides with the application company on the web or database server. The following figure shows a connection to a web page. User A wants to see the page index.html. The browser connects via the internet (represented as a cloud) to the company’s web server (web server with globe), represented by the gray arrows. The web server may look for further data from the database (server with “barrel,” because databases are often represented as barrels) and then sends the finished web page back to the browser, represented by the dashed arrows. The user’s browser then displays the page.
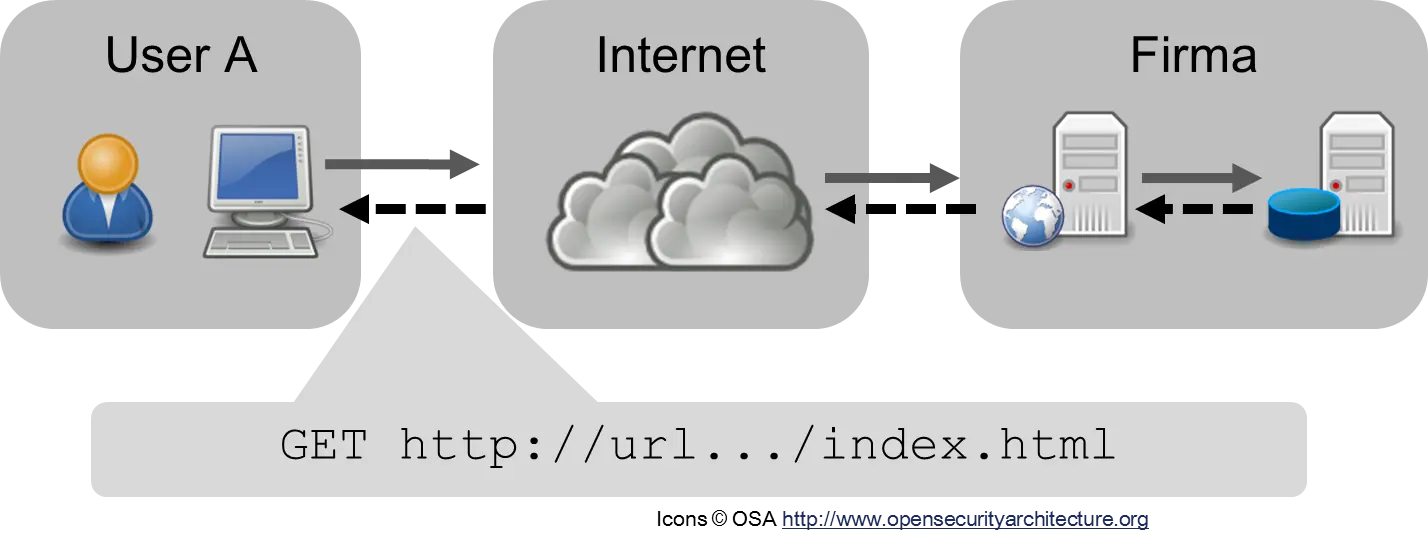
The data is on the company’s servers and is sent through the internet. While the data is traveling on the internet, it is readable by all “eavesdroppers” if it is not encrypted. For this reason, it is important to use an encrypted internet connection with HTTPS as often as possible.
But the actual data is on the company’s computers. It then depends on the company’s security precautions whether the data in the database and on the web server is secure. This situation must be taken into account in discussions about Facebook and Google. Critics once indignantly asked, “What are they doing with my data?” But the critic had stored “his” data on the social network’s computers. Was it still “his”? He used the service’s infrastructure. Data you don’t want to share should not be uploaded to social networks. With cloud storage, however, things are different: here, the cloud storage provider must ensure that the data remains secret.
Data in Companies
Work is organized nowadays based on data and processes. In modern factories, every production step is recorded in a database. Information technology is an important basic building block of companies. Companies are information-processing organisms. Typically, there are the following areas in companies [Dav14, Cor11]:
- Marketing
- Sales
- Manufacturing, Production
- Product Development
- Purchasing
- Finance
- Human Resources (HR)
- Management
Each of these areas requires different data in potentially different formats. It can happen, for example, that Finance uses a different definition for certain terms than Production. What is a “good customer,” for example? In large companies, it is important to standardize definitions and data, and to introduce so-called metadata management and master data management. These data contain uniform definitions that apply to the entire company.
The various areas of a company are subsystems of a complex system because they interact with each other and form several networks [Por85]. To describe these complex relationships, the terms supply chain and value chain have established themselves. Unfortunately, the term “chain” is not well-chosen, because one imagines a chain as being linear. A better term would be supply web or supply network.
The supply chain describes the processes and data required for the manufacture and delivery of products. It leads from raw materials and suppliers to end customers through the entire company. The “supply chain” is a scientific version of the network described in the story “I, Pencil” in Section 5.3.
Many companies model not only their product chains but also their service, finance, and information chains [Por85, Cor11]. In the value chain, costs are also taken into account. With the help of value chains, companies can be analyzed and their financial situation evaluated. Such value chains are a great help for optimizing processes.
For data processing in companies, different computer systems have traditionally developed:
- Supply Chain Management (SCM)
- Customer Relationship Management (CRM)
- Enterprise Resource Planning (ERP) for product development, production, and inventory
Supply Chain Management is used for computer-aided management of supply chains. Customer Relationship Management is modern customer administration and care. With Enterprise Resource Planning (ERP), the company’s resources are “managed,” a kind of modern inventory.
Supply Chain
The use of new technology must be financially worthwhile for a profit-oriented company, i.e., it must bring in more than the acquisition costs. Therefore, new technologies are usually first used in cost-intensive industries, such as automobile manufacturing.
Humans have always tried to improve the manufacture of goods. Today’s mass production of goods was started in 1904 by Henry Ford. Since that time, techniques have been sought to optimize production, i.e., to produce better goods with less use of resources and labor. However, research into improving a company’s “productivity” was rather “ad hoc,” i.e., not systematic and methodical. That changed in the 80s when the “supply chain” was introduced. This triggered a real supply chain boom. One finally had a conceptual tool with which the processes in organizations could be expressed [Por85, Cor11]. “Network thinking” was applied to companies. Supply chain management is a means of optimizing a company, becoming more efficient, and reducing costs.
Nowadays, supply chains are also exchanged between companies or complement each other. An automobile manufacturer usually has very many supplier companies. By combining their own supply chain with those of the suppliers, many automobile manufacturers have succeeded in keeping storage times as short as possible and receiving new deliveries “on demand.” With so-called “demand-driven supply networks,” it is even possible nowadays to “customize” products and offer them in very many variants. Today, you can assemble your personal car because manufacturers have become more flexible by improving the supply chain.
Marketing as a Science
The marketing department has to answer the following questions, among others [Cor11].
- Customers: Who are the customers? What interests them? What products would they buy? What would they spend on them? What bothers them about the products they have purchased?
- Competitors: What is the competition doing? What products do they offer and at what price? What products are planned?
- Markets and their regulation: What is the general economic situation like? Are the products seen as environmentally harmful? What measures are necessary for environmental protection and recycling?
The uncertainty (entropy) of the department is high, and therefore it needs information to reduce uncertainty. For this, it depends on high-quality data. Marketing has become a statistical science. Customer data can be taken from the CRM. Information about competitors, markets, or households is often purchased. The available data is meticulously examined by marketing to gain knowledge about the company’s market situation. The more information a company has in this area, the smaller the uncertainty and the greater the probability that the right decisions are made and the right products are offered to customers.
Sales
The sales department must fulfill the following tasks, among others [Cor11].
- Reporting: Creating reports on sales for management
- Sales Tracking: Number of sales, how well products are received in the market
- Trade Promotion: Advertising your own products, e.g., in supermarkets by setting up a special stand or through advertising campaigns
- Brand Value: Investigating the reputation of the products and the company
- Determining expenses for advertising and marketing
Here, the data for analysis is often even more difficult to obtain than in marketing because, for example, it arises on-site in supermarkets, is not present in a database, and cannot be purchased. The data is also very diverse, occurs in large quantities, and requires the internet. Often, the data is also needed as quickly as possible, so processing must take place as fast as possible. This is a typical use case for “Big Data,” which is described in Section 6.6. Much will change here with Industry 4.0 and the Internet of Things. The Internet of Things will be covered later in Chapter 10.
Processes as Data: BPM
A process is a sequence in time. Processes can be documented by writing down what you are doing for each time step. The most famous example is probably the diary or blog. People write down daily what is going through their heads. This allows you to read years later how you were doing, what you were thinking, what music you were listening to, etc. You have captured your life in data. You have a “memory.” In many industrial processes, it is also important to have a “memory.” Many production processes in industry are not monitored by humans, and processes on computers also run automatically.
But how can you describe these processes themselves? Or store them? How can you document the workflows in a factory and possibly improve them?
Process modeling tools and process modeling languages have established themselves here. One example is “Business Process Model and Notation” (BPMN). With this “language,” economic processes can be represented and even executed automatically, provided a sequence control system is available. This gives you “programmable” factories. The following figure shows a simple example of a BPMN diagram2:
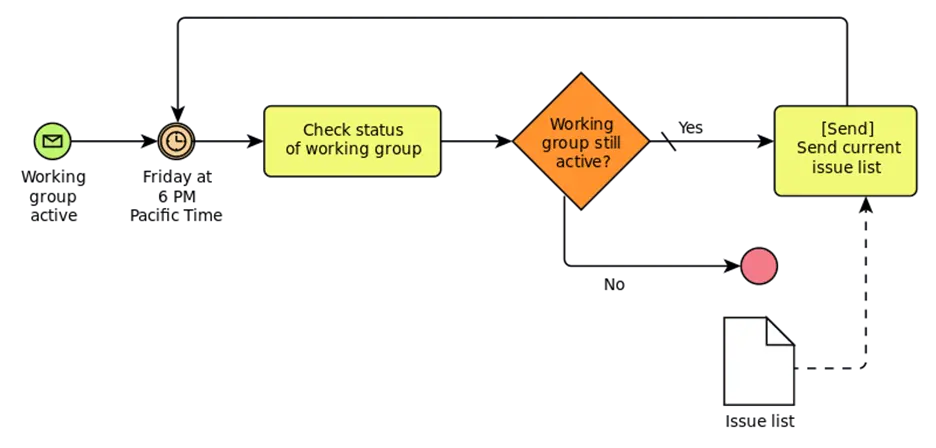
A BPMN diagram is a network, i.e., a graph. The nodes can have different types:
- Events: round circles
- Activities: yellow rectangles
- Gateway: diamonds
The edges also have different types:
- Sequence: solid line
- Message: dashed line
- Association (not present in the figure)
In the diagram above, an email is sent every Friday evening at 6 PM as long as the work group is active. Naturally, these diagrams can become very extensive and complex in a company.
“Process orientation” means that a company thinks in such “processes.” Many companies have switched to a “process-oriented” view of their company over the last 15 years. The management of these processes is called “Business Process Management” (BPM) [Dav14].
Important: Processes are data and processes process data.
Databases
Different Types of Databases
If data is to be kept permanently, it must be stored in a database or as a file. Over time, different types of databases have been developed [SF12]:
- Relational (RDBMS)
- Key-Value
- Document-oriented
- Graph-based
Each type has different advantages and disadvantages. Which one you use depends on the one hand on the type of data, but also on the intended use and the requirements of the system. For example, in an online store, many people go shopping at the same time. Sales processing should be as fast as possible. Thus, the order must be saved quickly in the database. But if the marketing of this online store wants to calculate, for example, the number of sneakers sold last month per zip code area for an analysis because a new sales strategy is planned, then that could possibly take a few seconds and a large part of the database would be “rummaged through.” This, in turn, could make the database slow, and then the sales mentioned above would take longer and customers would no longer be able to shop.
Which type of database to use must therefore be decided on a case-by-case basis.
Relational
Relational databases have been developed since the 80s. They were the standard for many years. With them, data is stored in tabular form. Mathematical relation theory is used for the exact definition of queries and operations, hence the name. A table consists of rows and columns. A row is also called a data record. Here, for example, is the table from Section 2.3 with the three “planets” 3:
| Id | Color | Mass | Position | Velocity |
|---|---|---|---|---|
| 1 | blue | 3 | (2, 1) | (2, 0) |
| 2 | gray | 4 | (5, 3) | (0, 0) |
| 3 | red | 2 | (9, 4) | (-1, -1) |
The “Structured Query Language” (SQL) was developed for interaction with the RDBMS [Dat13]. There are queries that can be used to read data from a table. The following query determines the position and velocity of the gray circle.
SELECT position, velocity FROM circles WHERE color = 'gray';
There is also a command for changing data.
UPDATE circles SET position = position + velocity;
And for inserting new rows.
INSERT INTO circles VALUES (4, 'orange', 3, (0,0), (1, 1));
What about simultaneous changes by multiple users? What happens if two users want to change the same data record? The so-called ACID principle was invented for this. The basis of this principle is the so-called transaction. This guarantees that changes are carried out one after the other and the database remains in an “orderly” state.
Now, not all data can be in one table or in one file. The following table has the same structure as the previous one, but different data records. These two tables can simply be appended to each other (“append,” “concatenated”).
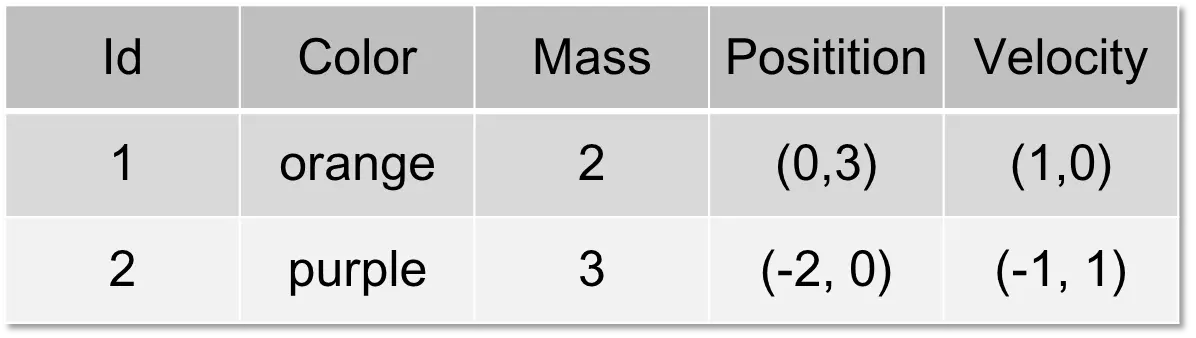
To combine data with different structures, you need at least one column that can be used to connect the data records. Let the following table be called “rgbs”.
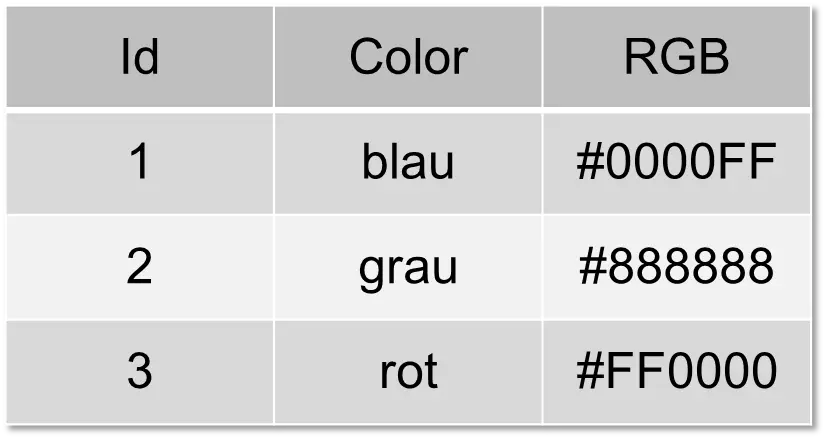
Then the first table can be connected to this one using the “Color” column. This connection is called a “join”.
SELECT circles.color, circles.mass, b.rgb FROM circles, rgbs WHERE circles.color = rgbs.color;
The result is the following table:
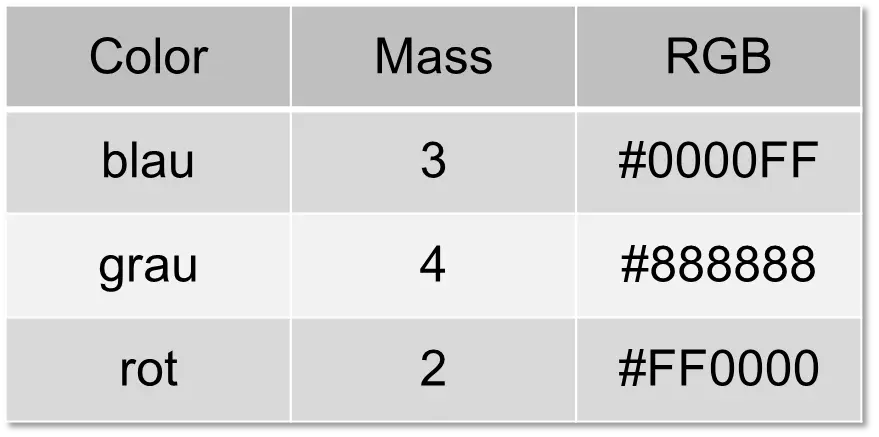
With a “join,” you can therefore combine several tables.
To be able to store data in a relational database, you have to arrange everything in tables that can potentially be “joined” with each other. Relational databases work best when the data is in a so-called normal form [SF12, Dat13]. This is not always practical for the user of the database because, for example, graphs and networks cannot always be easily squeezed into tables. But it was simple for the developer of the database because a relational database is easy to implement.
With today’s large amounts of data, databases can no longer be operated on a single computer; instead, a so-called distributed system is used. A distributed system consists of several computers that together form a single system. However, this distribution is incompatible with the ACID principle. The ACID principle guarantees that simultaneous transactions by different users always run properly, i.e., they are “consistent.” If multiple computers are now involved, this is no longer possible. A database cannot be simultaneously consistent, highly available, and partitioned (distributed). This insight is called the CAP theorem [SF12, CM16].
These limitations have led to the development of other types of databases, which are often also referred to as NoSQL databases.
Key-Value
For some application areas, tables are far too complicated. You only need a kind of notepad on which you can quickly write down a few values. Key-Value databases fulfill this requirement. A key-value store essentially only has a PUT method, with which new data can be written, and a GET method, with which data can be read. In the following sample session, the data of one of the three “planets” is written.
C:\>bin\voldemort-shell.bat test tcp://localhost:6789
Established connection to test via tcp://localhost:6789
> put "u:color" "blue"
> put "u:mass" "3"
> put "u:position" "(2, 1)"
> put "u:velocity" "(2,0)"
> get "u:color"
version(0:1) ts:1447771236296: "blue"
>
First, the data is written with “put,” and with “get,” the color is determined. Very simple and rudimentary, but the processing speed is much higher than with a relational database. Project Voldemort is used in the example4.
Document-oriented
For other applications, in turn, tables are too simple. This particularly concerns data that is “nested” within itself. Much data is already in JSON and XML format. It would be practical to save these documents directly without converting them into a tabular form. In Section 6.2, we already saw a simple example in JSON. In reality, however, JSON documents are “nested”: an attribute can in turn have a complex JSON document as an element. It would be counterproductive to try to “squeeze” this data into tables.
We cheated a bit with the data in JSON because we saved the position and the velocity as strings “(4,1)” and “(2,0)”. The computer thinks it’s text and doesn’t know that it’s a vector.
{"color":"blue","mass":3,"position":"(4,1)","velocity":"(2,0)"}
We can change that by now inserting a “sub-document” using curly braces:
{
    "color": "blue",
    "mass": 3,
    "position": { "x": 4, "y": 1 },
    "velocity": { "x": 2, "y": 9 }
}
After “position” follows a “sub-document,” which in turn contains the attributes “x” and “y.”
As a database, we use Apache CouchDB5. The low-level API is HTTP, and inserting a circle happens as follows on the command line:
curl -H 'Content-type: application/json' -X POST http://127.0.0.1:5984/model -d '{ "color": "blue", "mass": 3, "position": { "x": 2, "y": 1 }, "velocity": { "x": 2, "y": 0 } }'
This looks more complicated than it is: -H specifies the content of the document, in this case it is “application/json,” -X says that the message should be stored “POST,” and the document itself is specified with -d. But there is also a web interface. Querying CouchDB is done using the MapReduce framework. The result of a sample query is shown in the following screenshot.
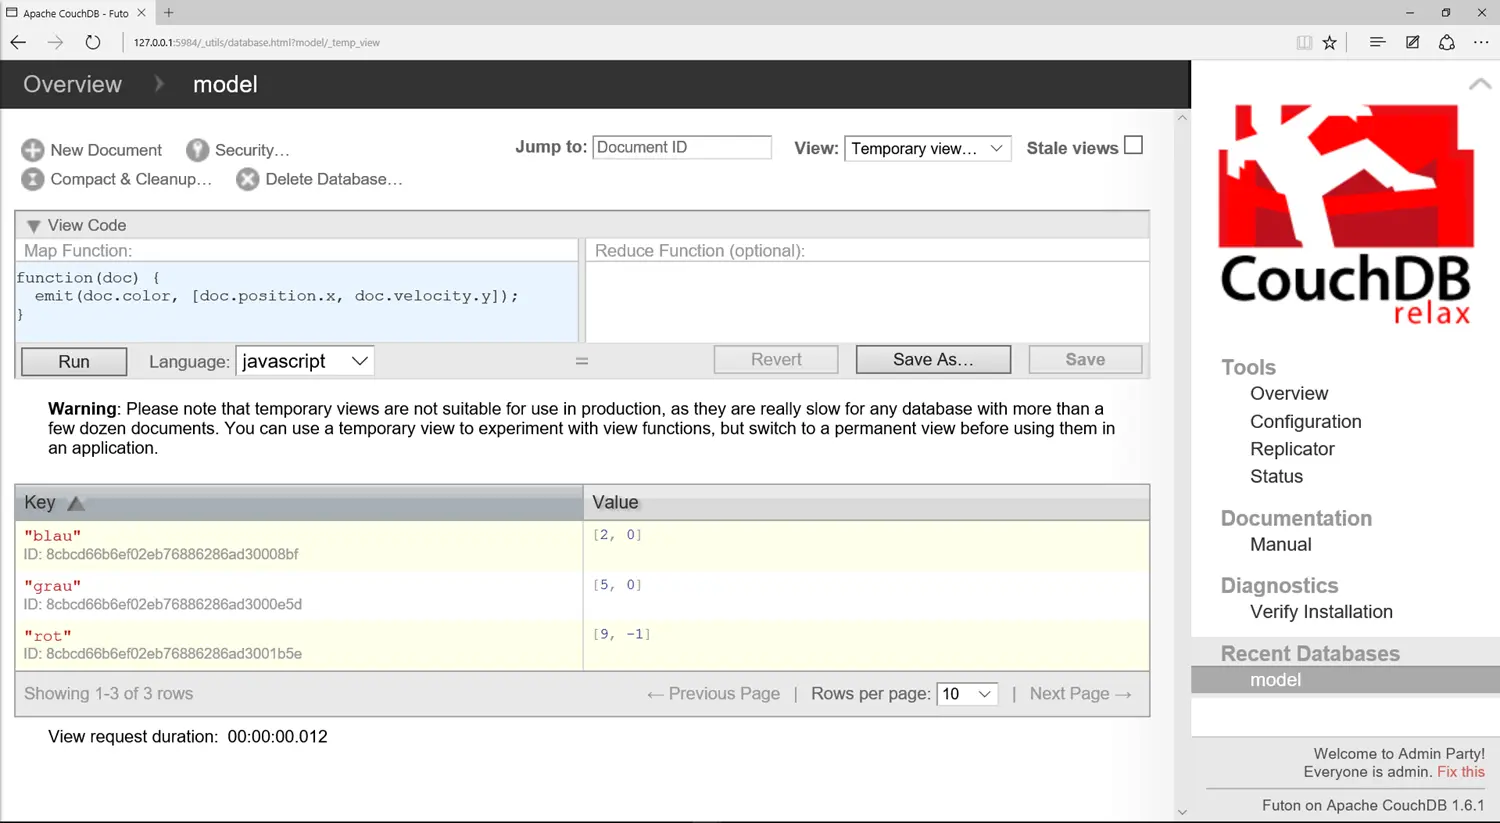
The query function is specified in JavaScript in the top left window. Below, in the yellow-highlighted windows, the three spheres are visible in the answer. You can therefore directly access the x and y coordinates of the nested elements with “doc.position.x” or “doc.velocity.y.”
Graph-based
Graphs also process poorly with relational databases. You would have to have a table for the nodes and a table for the edges. Very many joins are necessary here. Therefore, graph databases have been developed in recent years. These place higher demands on computing capacity and memory, thus requiring newer computers, but are significantly easier to program.
We use the graph database Neo4J6, of which there is a “Community Edition” that anyone can use. As an example, we use the social network example from Section 2.3, which contains the people Anton, Berta, Charlie, and Dennis and the cities Berlin and Cologne. The language of Neo4J is called Cypher, and the graph can be created with the following statement.
CREATE
    (A:Person {name: 'Anton'}),
    (B:Person {name: 'Berta'}),
    (C:Person {name: 'Charlie'}),
    (D:Person {name: 'Dennis'}),
    (K:City {name: 'Cologne'}),
    (Be:City {name: 'Berlin'}),
    (A)-[:KNOWS]->(B),
    (A)-[:KNOWS]->(C),
    (B)-[:KNOWS]->(A),
    (B)-[:KNOWS]->(C),
    (B)-[:KNOWS]->(D),
    (C)-[:KNOWS]->(A),
    (C)-[:KNOWS]->(B),
    (D)-[:KNOWS]->(B),
    (A)-[:LIVES_IN]->(K)-[:LIVES_IN]->(A),
    (C)-[:LIVES_IN]->(K)-[:LIVES_IN]->(C),
    (B)-[:LIVES_IN]->(Be)-[:LIVES_IN]->(B)
In the first few lines, the nodes are created. The nodes have two different types: Person and City. Then the nodes are connected with edges according to the scheme (source)-[edge type]->(target).
Neo4J also has a web interface that can automatically draw the graph.
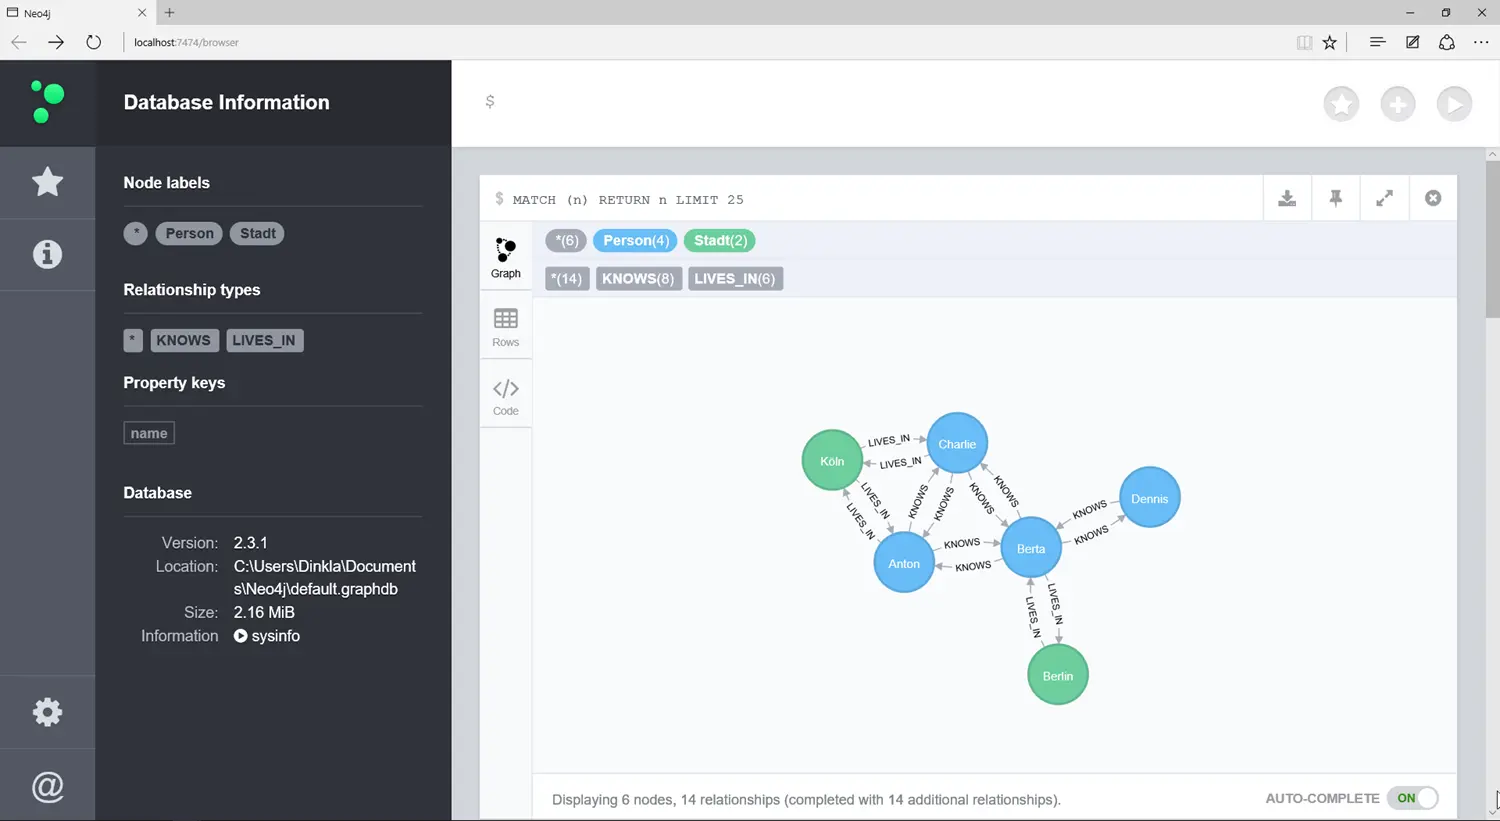
The query works a bit differently than with SQL. Here you have to learn a new query language. The query used …
MATCH (n) RETURN n LIMIT 25
… simply returns the first 25 nodes and their edges. You can also search based on an attribute like the name.
MATCH (p:Person) WHERE p.name = 'Berta' RETURN p
This query only returns the single node for Berta.
The following query returns all people Anton knows, namely Berta and Charlie:
MATCH (p:Person)-[:KNOWS]->(q) WHERE p.name = 'Anton' RETURN q
You can also ask more complicated queries, such as “Who knows someone in Cologne?”
MATCH (k:City { name: "Cologne"}), p-[:KNOWS]->(q)-[:LIVES_IN]->(k) RETURN p,q
Anyone who would like to study graph databases further is recommended to read the book “Graph Databases” by Ian Robinson et al. [RWE15].
The Data Warehouse
Section 6.2 explained that there are different systems for different departments in companies: CRM, SCM, ERP. For a company, however, it is important that there is a central point where all important data is stored uniformly:
- Data must be consistent: same names, taxonomies, and definitions.
- One source of truth: if there are several databases and values differ, the company has a problem.
Therefore, it is important in companies to have a database in which all data important for the company is available. This database is called a Data Warehouse (DWH). The Data Warehouse is the central organ of a company. It contains information on the state of the company from all business areas. For this purpose, the data must be imported from the individual systems, CRM, ERP, etc., into the DWH. The simplified filling process of the Data Warehouse (DWH) is shown in the following figure:
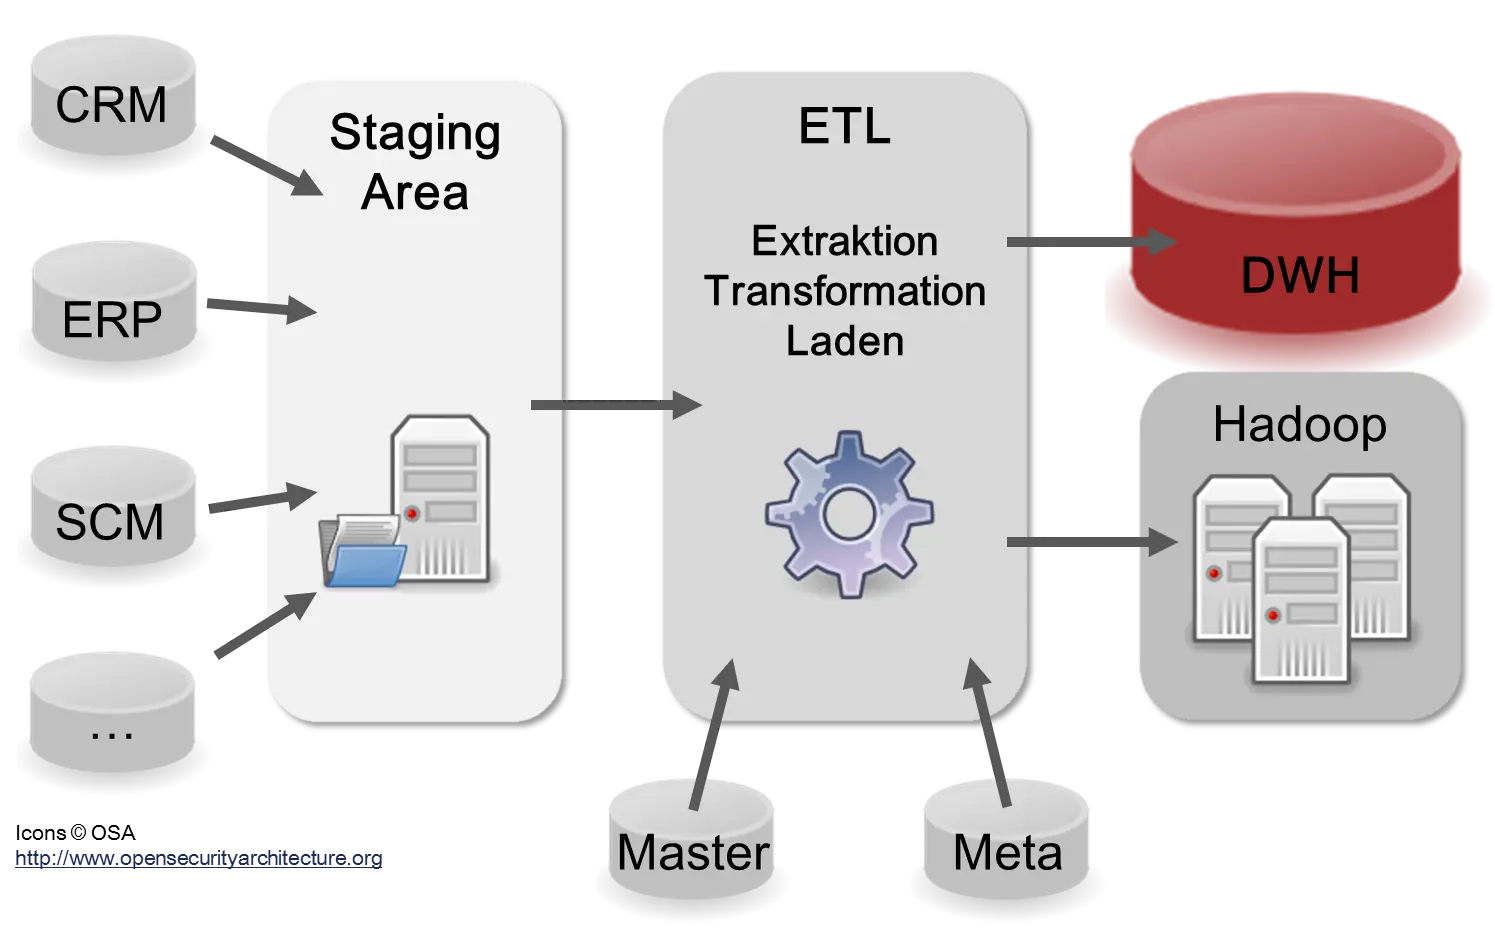
In reality, there are usually many more than just the three systems shown in the diagram: CRM, ERP, and SCM. In large companies, there are hundreds to thousands. The reason lies in the many different applications, web services, and microservices used in a company. Most of these services will have their own data format and follow different standards. The storage location of data in a Data Warehouse is usually a relational database or a distributed file system with Hadoop. The advantage of Hadoop is that it can also store semi-structured and unstructured data [Dav14].
Company-wide master data is important for the uniformity of reporting. All definitions and taxonomies used in the company are maintained here. The metadata defines the format, data type, and content of the data, i.e., the tables and files. Sometimes the ETL processes themselves are also stored as metadata. This is important for analyzing the provenance (lineage) of the data. Because if incorrect data is discovered in the DWH, it is important to be able to trace the error back to the source systems in order to fix it there. Since information is an important asset in a company, it is also important to be clear about the quality and trustworthiness of the data. A large part of the work on a DWH lies in adapting the data to each other and ensuring quality. There is the saying “Garbage in, garbage out” [IL14, CM16].
In the ETL process, the following steps must be considered here [IL14, Ols02]:
- Data Integration: Remove inconsistencies, input errors, wrong values, missing values.
- Data Maintenance: Standardize taxonomies, user inputs.
- Aggregation: Calculating data up to the day, month, quarter, or year level.
- Enrichment: E.g., with purchased data.
- Compression: Removing columns or value reduction (“binning”).
- Updating the metadata.
Business Intelligence
The DWH is the basis for all information in the company. The analysis of data is very important for companies, so much so that some companies now have a Chief Analytics Officer (CAO) who is responsible for data analysis [Dav14, IL14]. It must be taken into account here that every company department has a different view of the data and interprets it differently. The finance department of a telecommunications company will have a different view of the technical infrastructure because it is only interested in costs. The technical department, however, is interested in details, such as which technical standards the devices implement, etc. For this reason, there are so-called “Data Marts” that are specific to each department. The following figure shows two data marts for Sales and Marketing as examples.
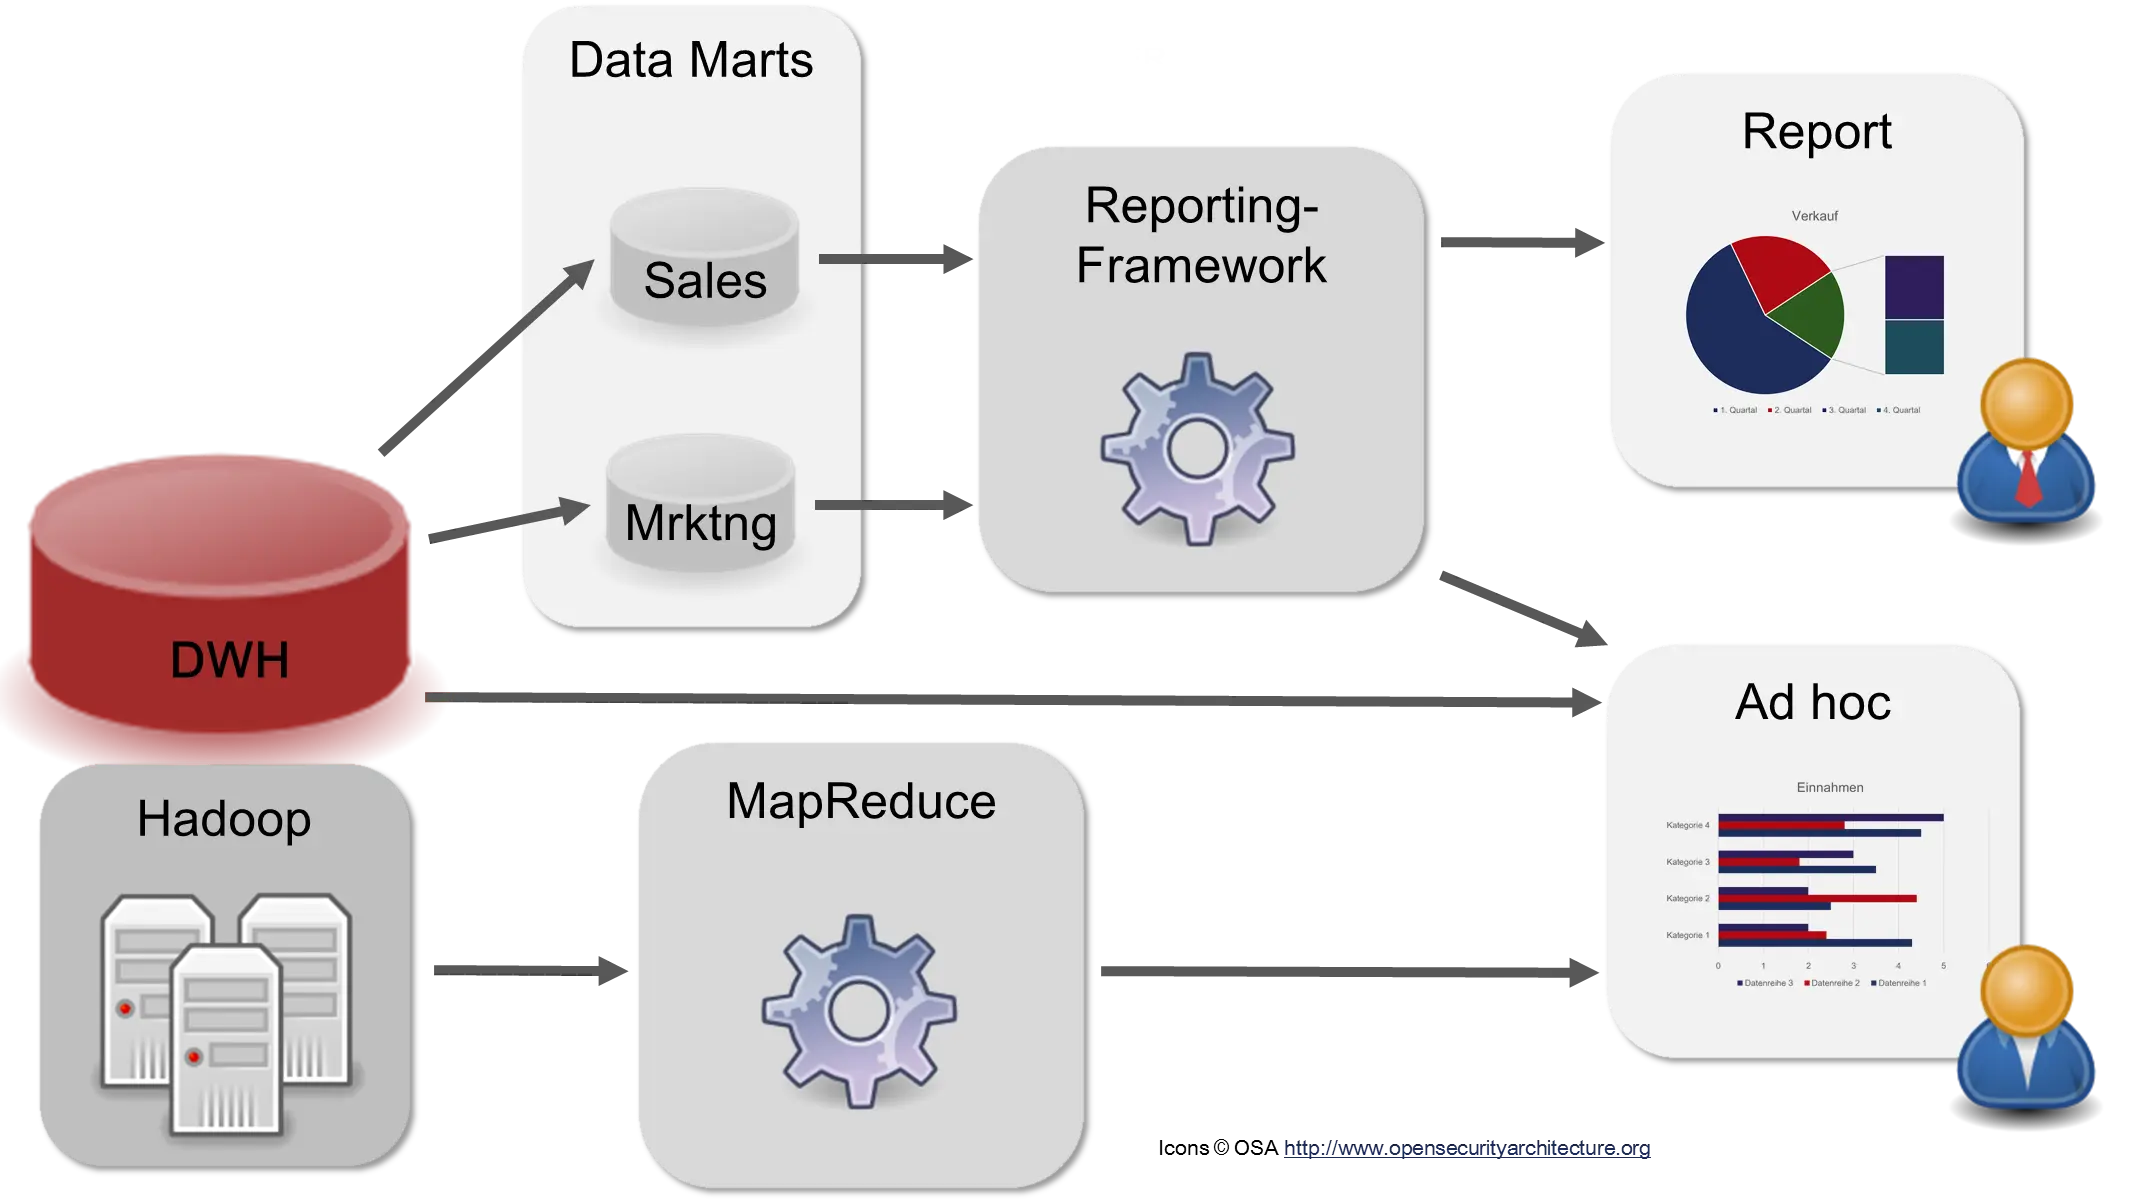
The DWH, the Data Marts, and often Hadoop serve as the basis for the “consumers” of the DWH. There are different types of users: Management wants to be informed about the status of the company. Usually, there are ready-made reports with Key Performance Indicators (KPIs) that only need to be retrieved or are automatically generated and sent via email at certain times. Product developers and data scientists, on the other hand, search the data for new insights or for ways to create new reports.
The tasks are thus (greatly simplified) summarized:
- Reporting and record-keeping
- Data analysis: Ad hoc queries, dashboards
- Data Science, Data Mining
- Data exploration: Exploring the data—what is actually there? What could be done?
- Data visualization
As you can see, the “Intelligence” in “Business Intelligence” is not necessarily to be translated with the German word for “cleverness,” but rather with “information gathering,” as in the American “Central Intelligence Agency” (CIA).
Big Data
As it goes with many technical developments, demands rise with progress. While companies used to be satisfied if they had current data weekly, it then had to be daily, then hourly, and today preferably in real-time. Also, a large part of the data occurring in industry was not analyzed because it was unstructured or only semi-structured [Dav14]. However, many companies want this data in the DWH. Expectations have risen, and the existing Data Warehouse architecture must be adapted to these new requirements. And this new technique is called “Big Data.”
What now turns a traditional DWH system into a Big Data system?
Opinions differ here, but generally, there is agreement on the 3 V’s [Dav14, CM16, Kri13]:
- Volume: The amount of data must be so large that it can no longer be processed on a single computer.
- Variety: The data must have different formats, i.e., be semi-structured or unstructured.
- Velocity: Immediate processing is desirable.
These new “V” requirements, however, usually require changes to the structure of the DWH, the ETL processes, and the operations.
The first requirement, “Volume,” led to the use of distributed systems. Because the data became too large to process on only one server, the data and the calculations had to be distributed across several servers.
The second requirement, “Variety,” can potentially mean a high workload and thus high costs. Semi-structured data can be very difficult to analyze. Audio data must be converted into text form. The automated recognition of videos is not yet sufficiently developed. Natural language texts require NLP processing. At the present time, these last two techniques are often still subjects of research and (not yet) always automatable. Proper integration into an existing DWH also requires data cleaning, adjustments to master data, etc.
The third “V,” “Velocity,” is intended to ensure that data can be analyzed as quickly as possible. For this, however, the existing DWH sometimes needs to be expanded and, for example, a “Speed Layer” introduced in the so-called Lambda architecture [MW15]. Continuous processing of the data is now required.
Big Data is therefore a technique with which more data and unstructured data can be processed at a higher speed than before. This sounds simple on the one hand, but is quite complicated on the technical side.
Now there are many books that warn of the dangers of Big Data. So where is the danger? Big Data itself is as harmless as a database itself. Possible dangers lie in who uses this technology for what purpose.
-
In the media, the connection data in the context of the NSA affair around Edward Snowden were often called “metadata”, which is actually not correct. ↩
-
See https://en.wikipedia.org/wiki/File:BPMN-AProcesswithNormalFlow.svg ↩
-
This representation is a bit simplified, because the vectors (2,1), (2, 0) do not exist directly in SQL like this. ↩