While i was cleaning up my hard disk on my Linux in 2007, i needed a program that displays the disk
usage graphically. I didn't find a suitable one on the web.
At that time i was learning Groovy and it's for rapid application development, isn't it. So i gave it a try.
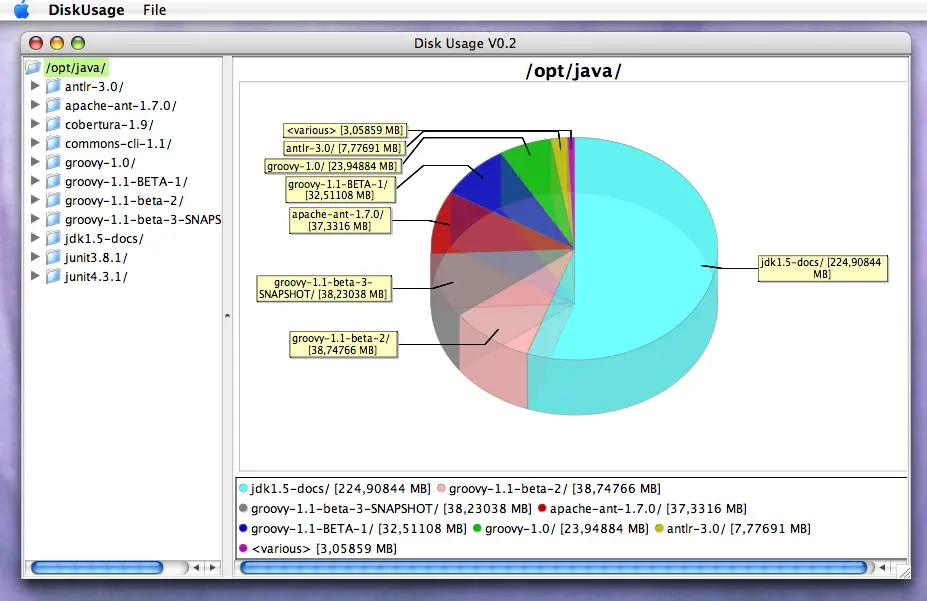
Requirements: The user chooses a directory, then the directory structure is displayed as a tree and a pie chart is displayed that shows the usage of disk space.
If the user selects a subdirectory it's disk space usage will be shown in the pie chart.
The chart is drawn using the JFreeChart library
which is written in Java. This is one of the reasons i switched from Perl to Groovy: the high quality
libraries available.
Notes on Design and Implementation
Overview
Basically there are the three programming tasks.
The contents of the directory, i.e. its subdirectories and files, have to be analyzed and stored.
The graphical user interface has to be designed and implemented.
The chart has to be drawn and fed with the data from step 1.
Step 1
For step 1 there is a straightforward recursive algorithm that
is easy to implement if one knows the Java File class.
The data will be stored in a tree data structure.
Step 2
The implementation of the GUI with the Groovy Swing Builder is
rather a specification with a domain specific language (DSL).
The window in the screenshot above is implemented with simple statements like the following.
The hierarchical structure of a Swing GUI is reflected by the opening and closing braces.
For all the Swing-Jxyz classes there is a "wrapper" function used in the SwingBuilder,
e.g. "menu" for "JMenu". The actions and the dialogs are defined as following.
defactionAbout=swing.action(name:'About ...',closure:this.&actionAbout,mnemonic:'A',accelerator:'F1')deffileChooserDialog=swing.fileChooser(id:'fileChooser',fileSelectionMode:JFileChooser.DIRECTORIES_ONLY)DefaultTreeCellRendererrenderer=newDefaultTreeCellRenderer()renderer.setLeafIcon(renderer.getClosedIcon())// Only display folder icons in the tree
See the source code for all the details. The pie chart is initialized and configured with the following statements.
defpiedataset=newDefaultPieDataset();// the data of the chart
defchart=ChartFactory.createPieChart3D('untitled',piedataset,true,true,true)chart.backgroundPaint=Color.whitePiePlot3Dpieplot3d=(PiePlot3D)chart.getPlot();pieplot3d.setForegroundAlpha(0.6F);pieplot3d.setNoDataMessage('No data to display');
Step 3
The dataset of the pie chart is updated with the following piece of code. The class Element
is a node in the directory tree.
With Groovy rapid application development is possible, provided you have enough practise with
Java libraries and Groovy's features.
Extension 2012: Parallelization with GPars
I improved the performance with GPars.
A new thread pool is startet with GParsPool.withPool and for each directory a new task is created
with GParsPool.runForkJoin.
While I was reading the excellent book by Kevin Suffern "Ray tracing from the ground up", I implemented a ray tracer in Java and wrote a DSL in Groovy, to...