Using Elasticsearch with Spring Boot - Analyzing the emails with Kibana
May 28, 2015
This is the last part in a series of four. It shows how to analyse the emails with Kibana.
Kibana is a analytics and visualization platform for Elasticsearch. You can run a kibana docker container with:
$ docker run -d --name kibana-dev --link es-dev:elasticsearch -p 5601:5601 kibana:4.1
The --link es-dev:elasticsearch links the kibana container to the previously started Elasticsearch container es-dev (see above).
After the container is started, you can connect to port 5601 and you'll see the following screen:
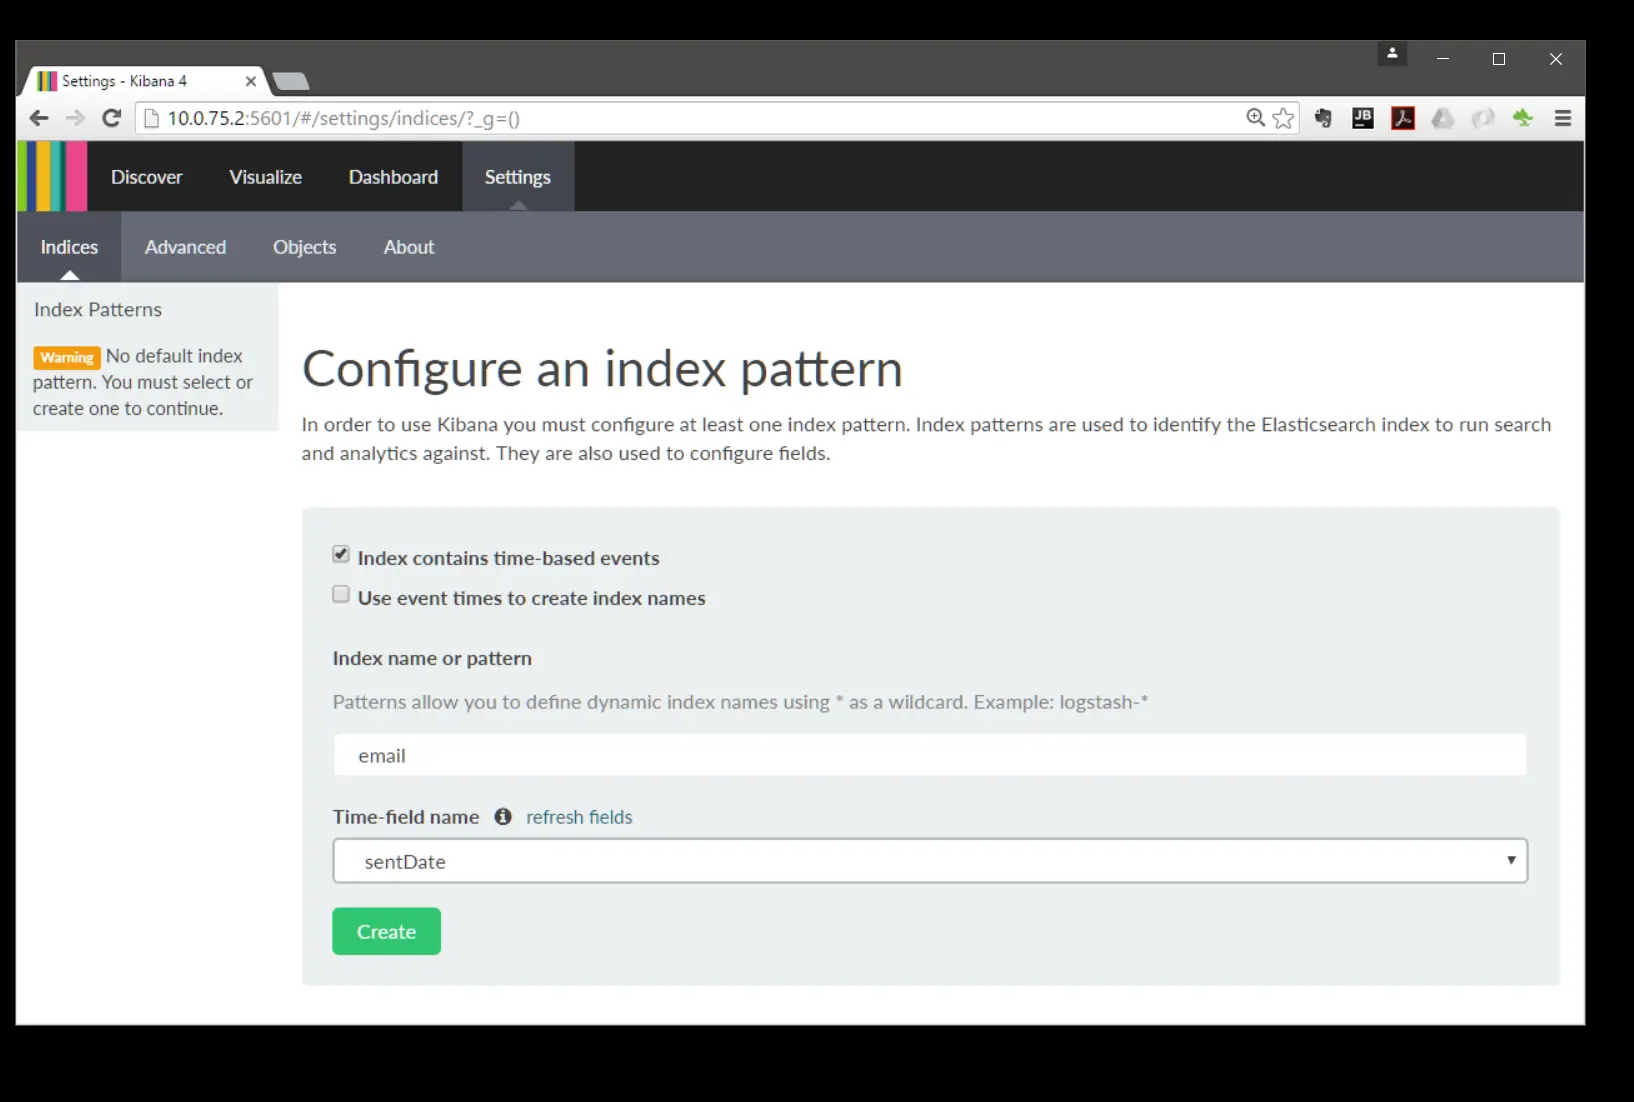
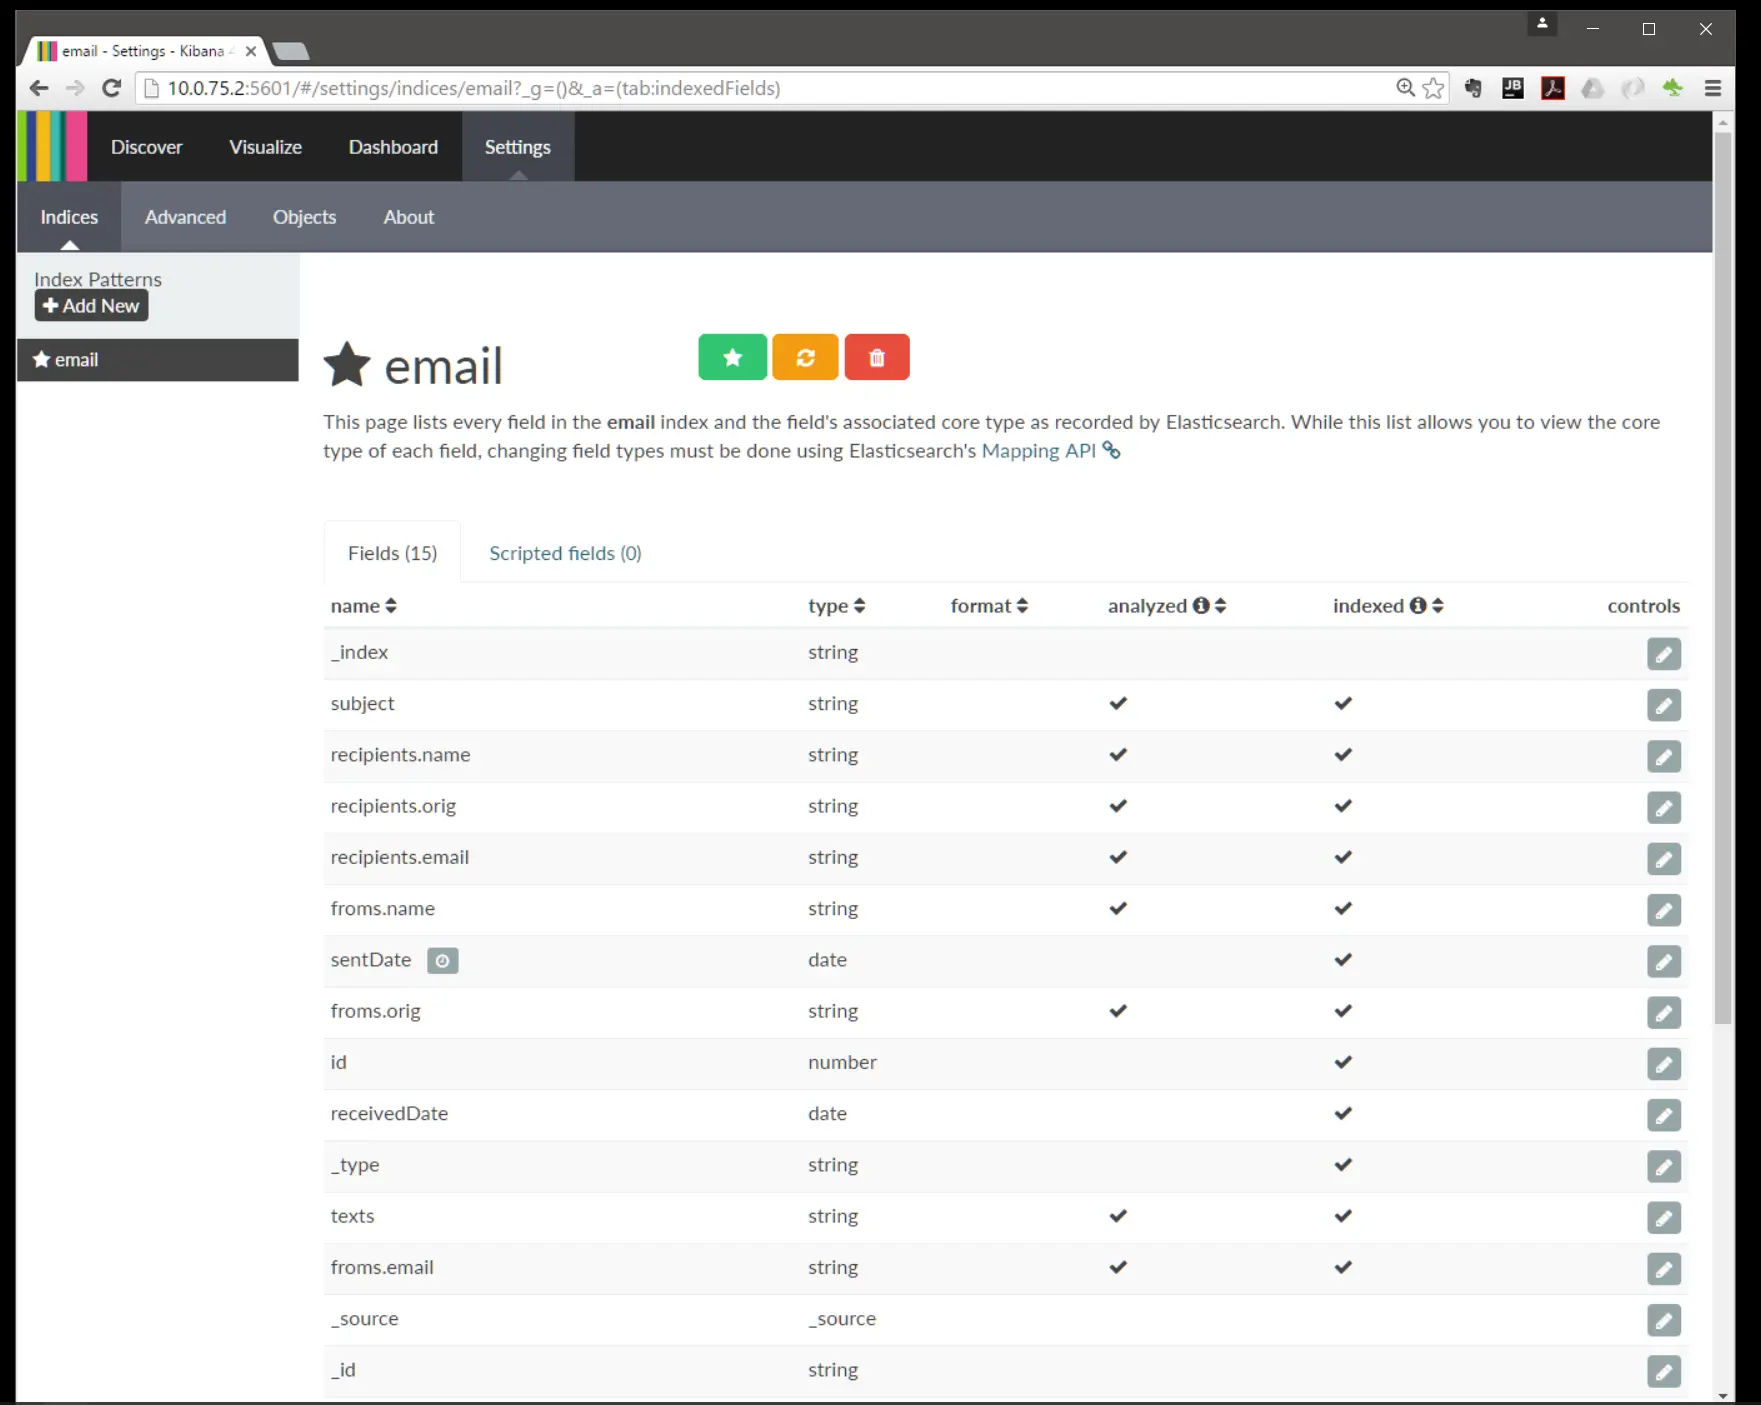
Kibana needs a so called "index pattern", simply type in "email", press "refresh fields" and choose the "sendDate" attribute. So kibana uses the "send date" as the "time dimension". The following screenshot shows, that kibana now knows the metadata of the emails.
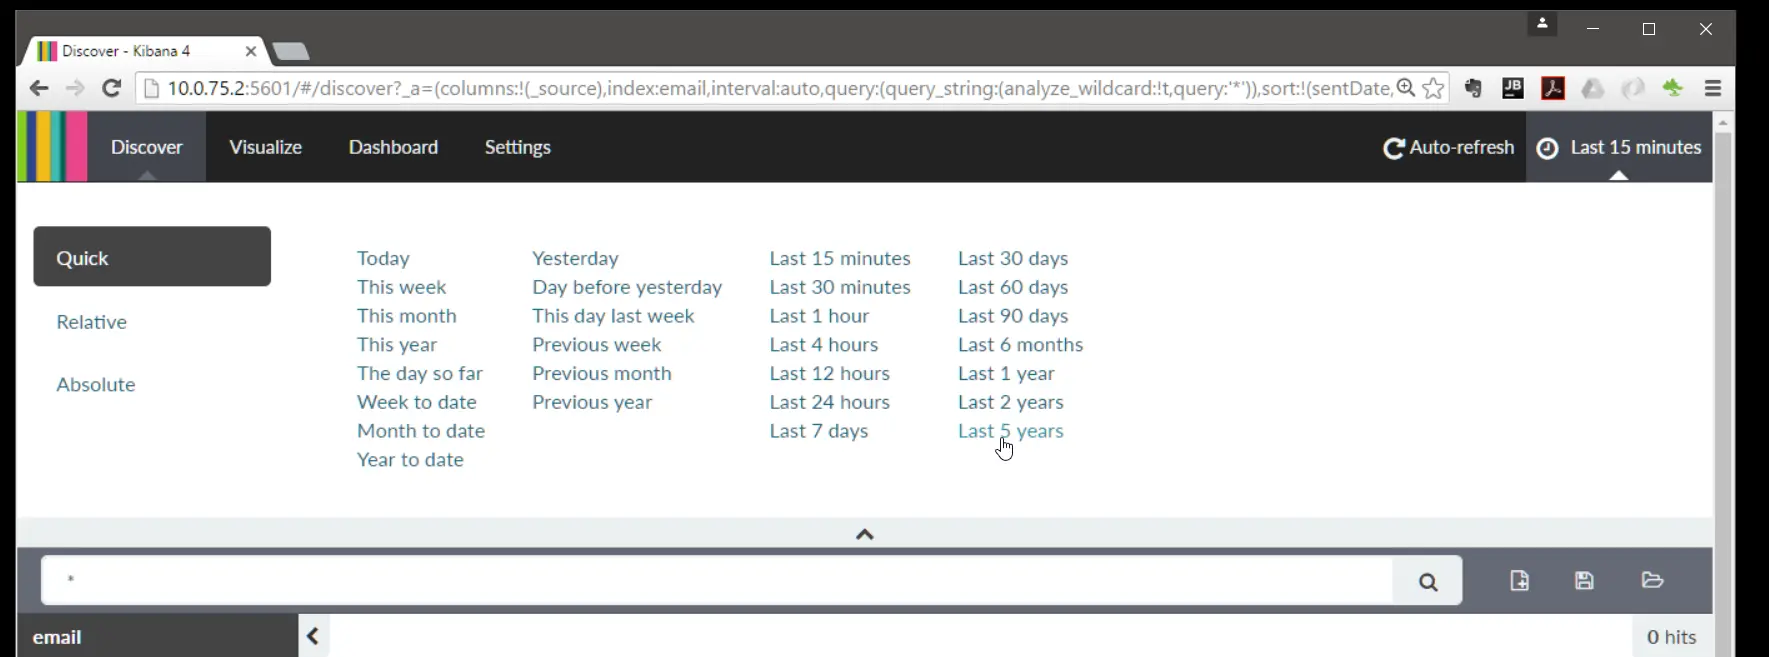
To analyse data you have to set the time dimension. Kibana offers a lot of possibilies as the following screenshot shows.
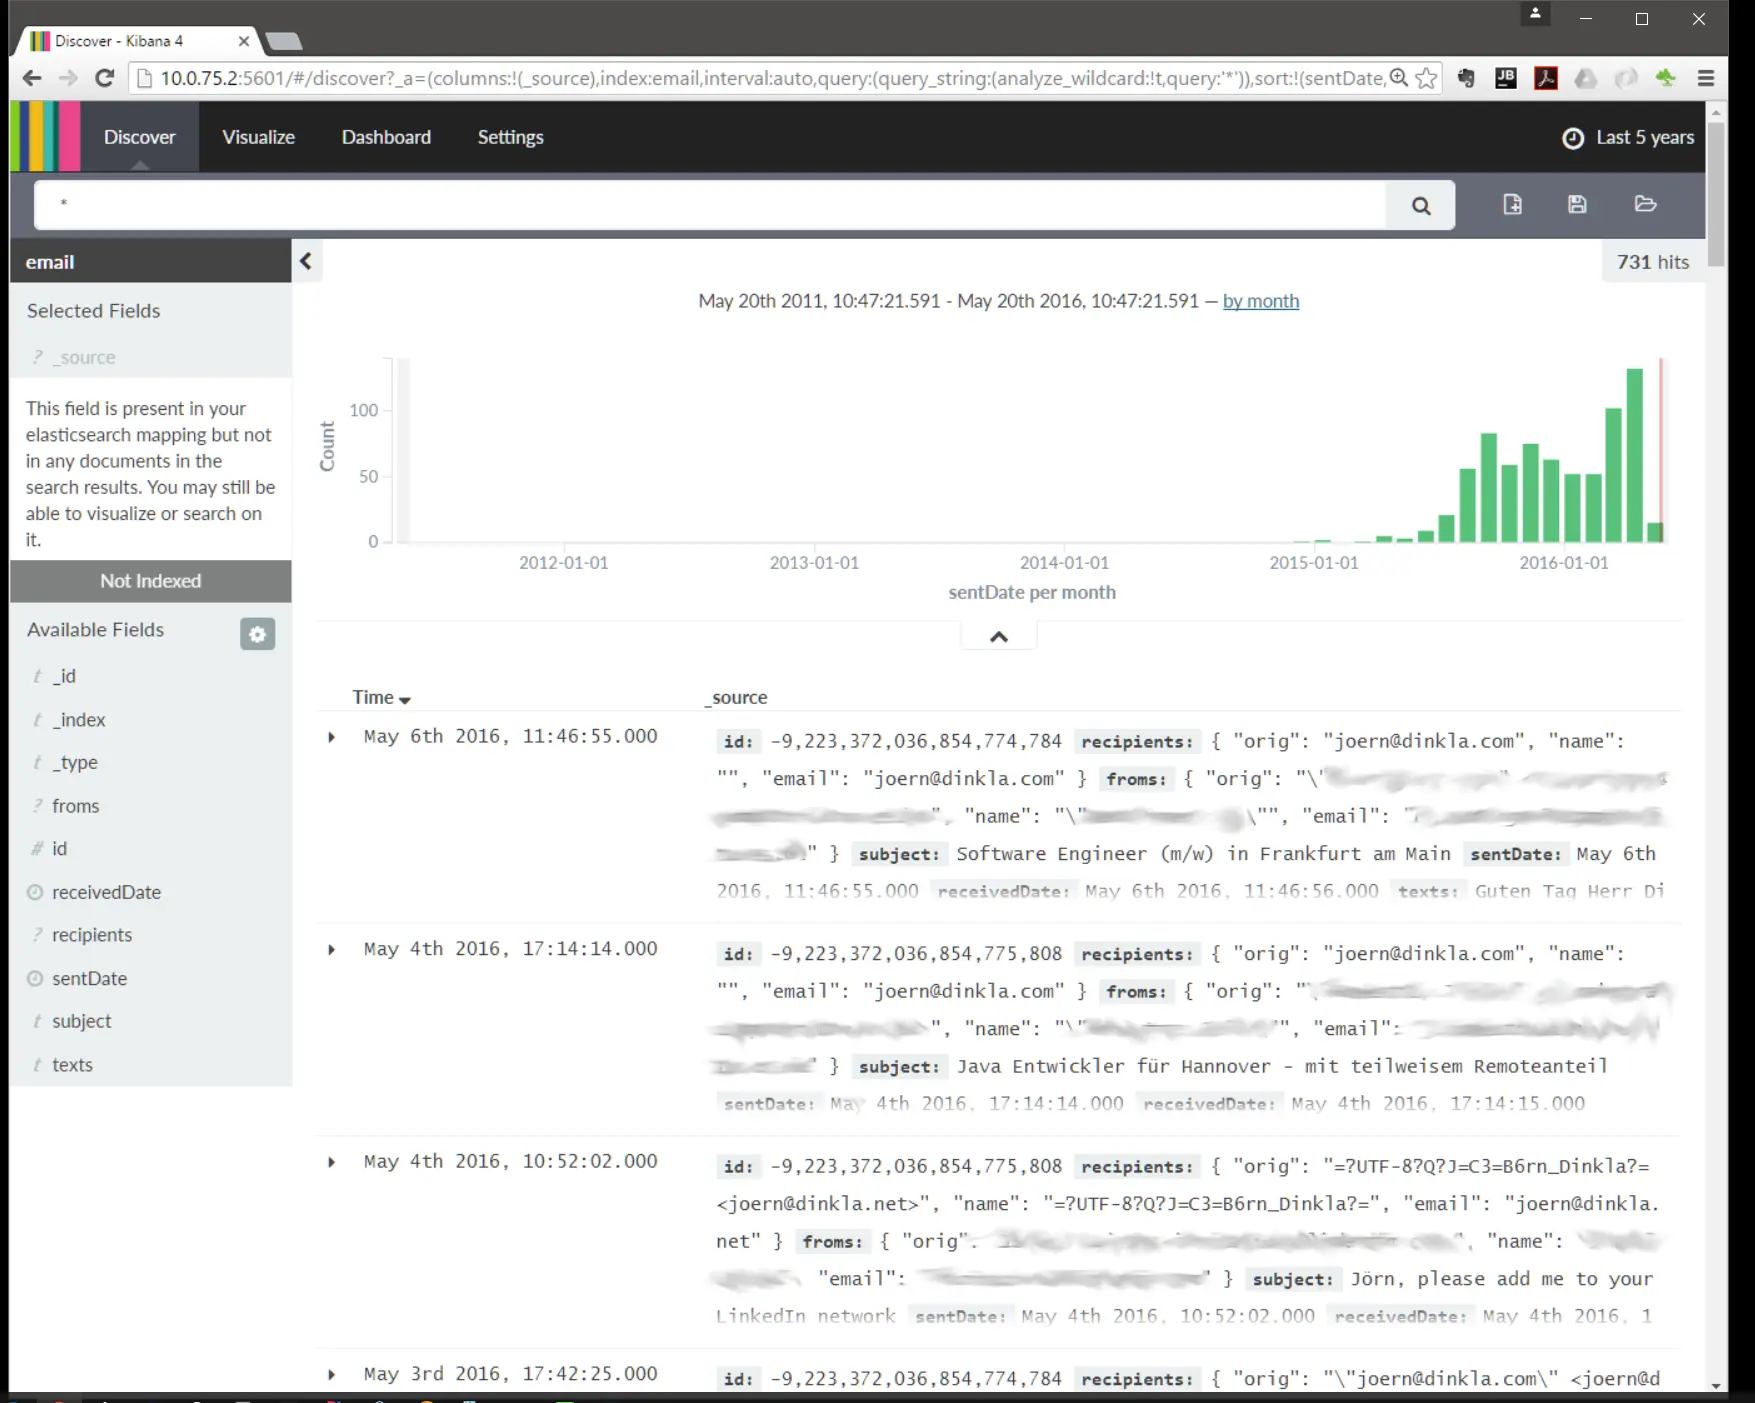
In the "Discover" tab of kibana you can analyze your data.
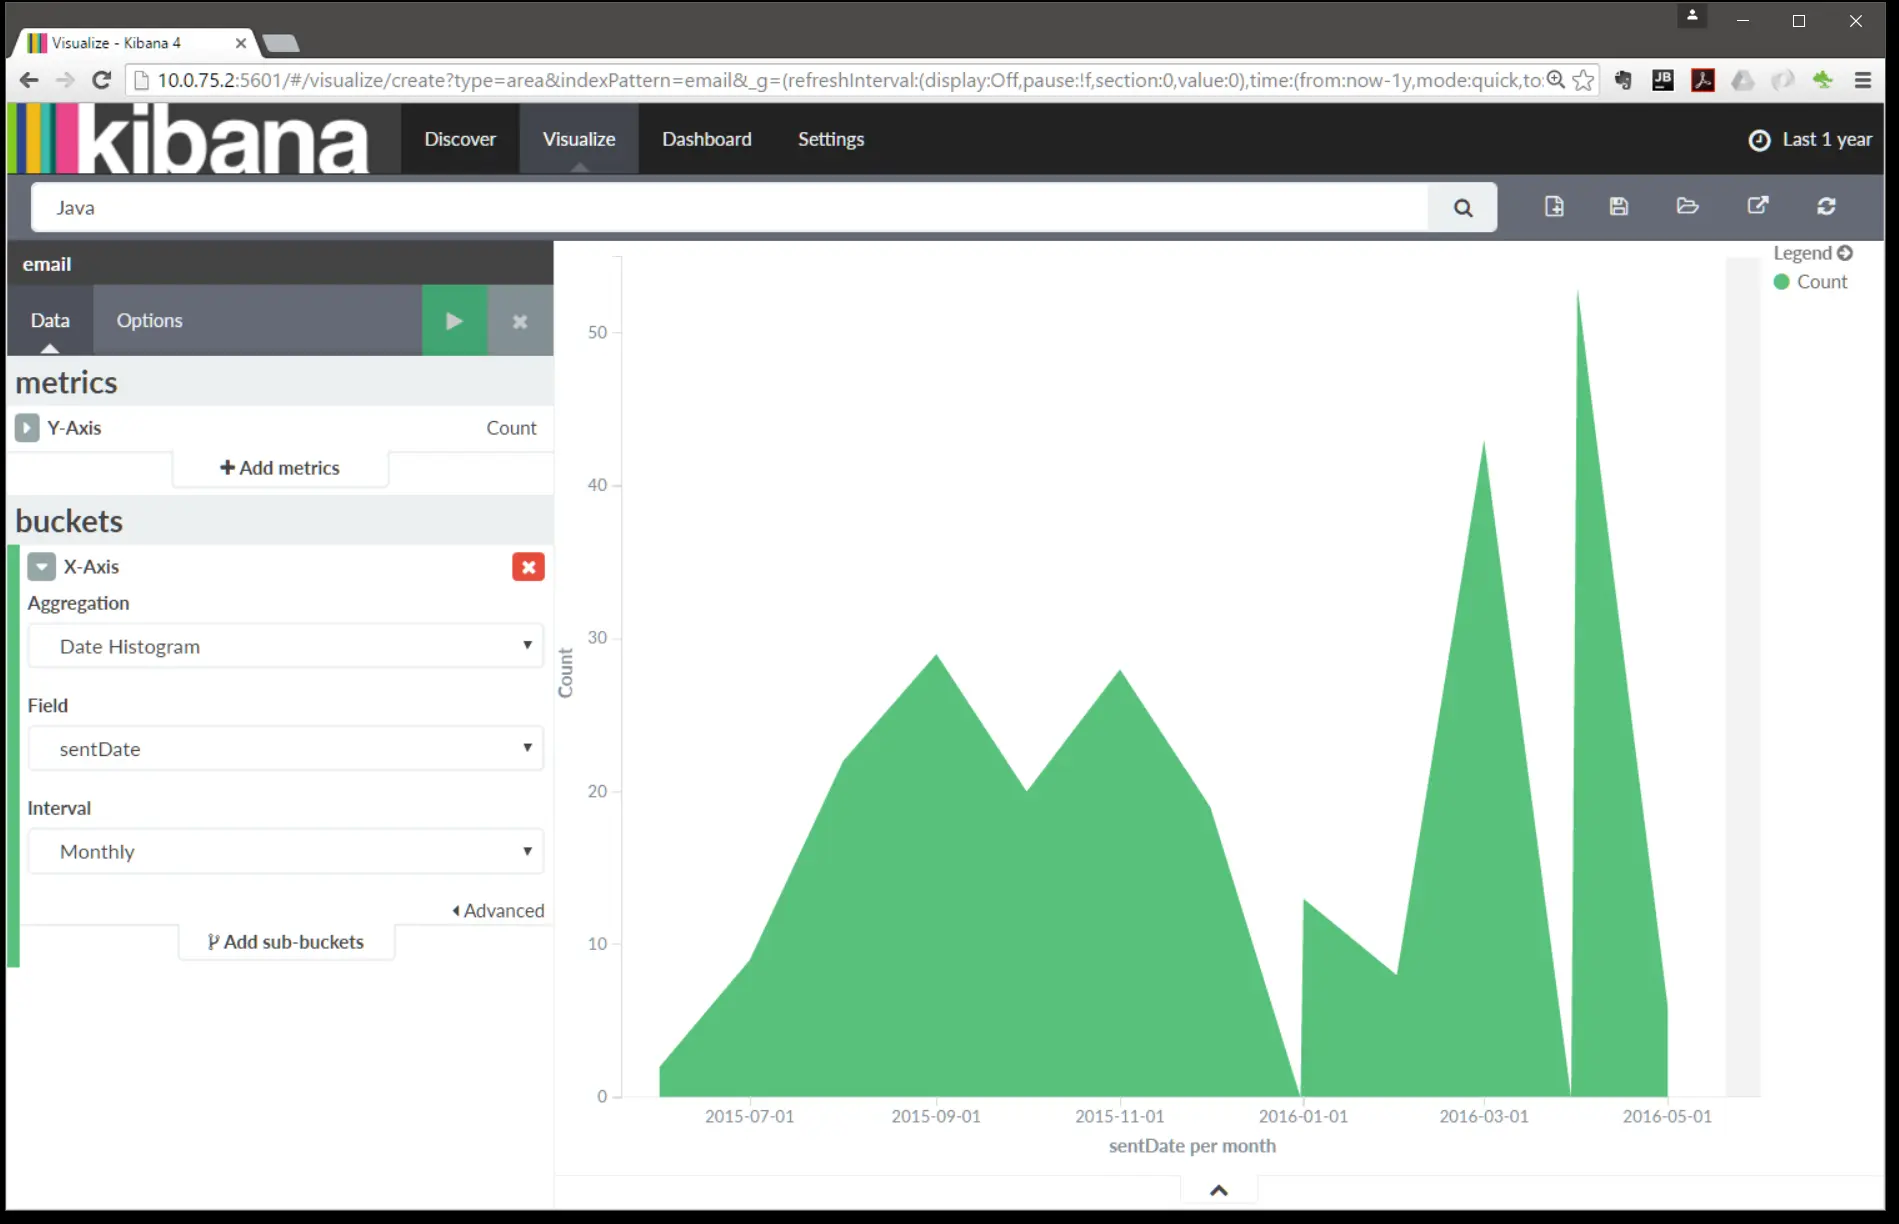
And in the "Visualize" tab you can create diagrams. Here fore example is the number of Emails containing the word "Java".
Cleanup
You can stop the docker container with
$ docker stop kibana-dev